Study X
The Debt, the Waste and the Tax
The national debt from 1790, CBO’s path for the next thirty years, and the two questions: what is wasted, and who pays.
We shorten the distance between a problem and its solution.
What the country owes, what it pays to carry it, and what would change either.
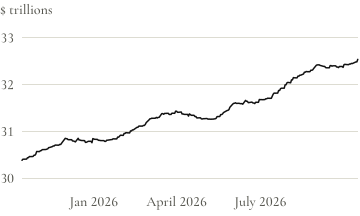
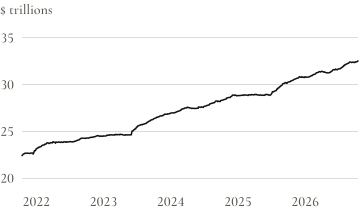
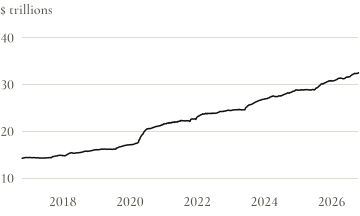
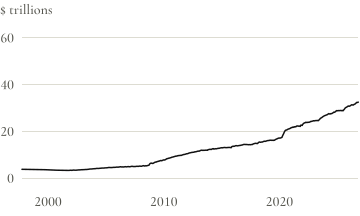
Highest in data back to 1997
$32.54 trillion
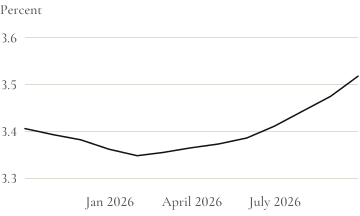
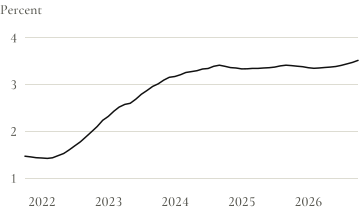
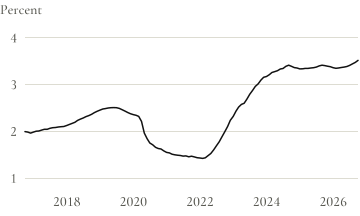
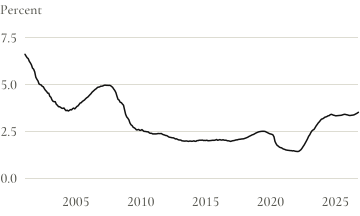
Highest since Sept 2008
3.518%
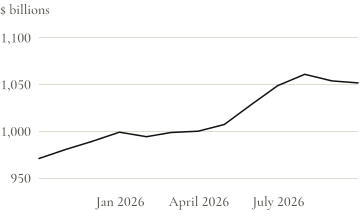
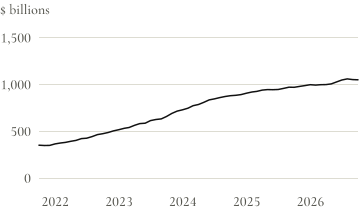
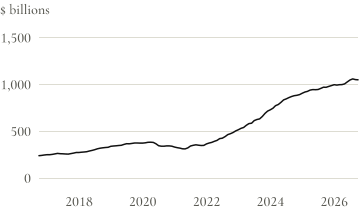
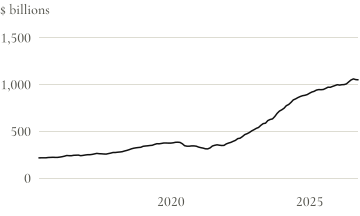
Up $80.8 billion in a year
$1,051.8 billion
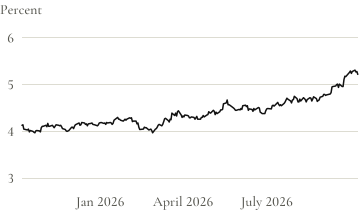
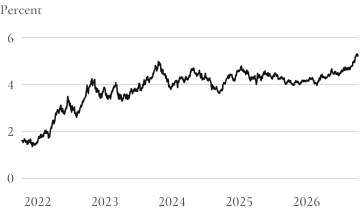
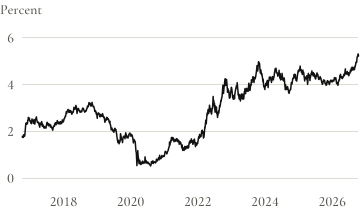
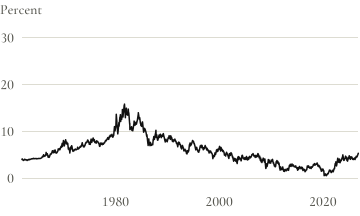
Up 1.09 points in a year
5.22%
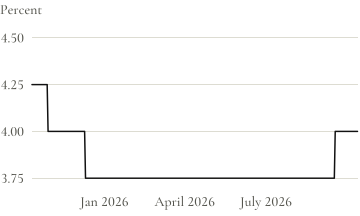
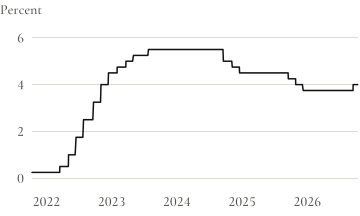
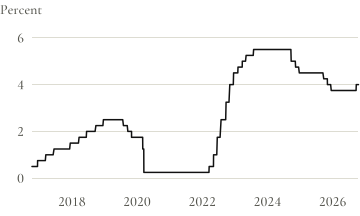
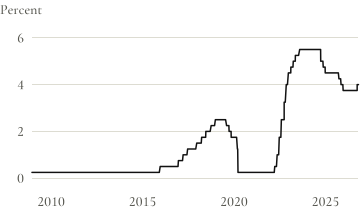
Down 0.25 points in a year
4.00%
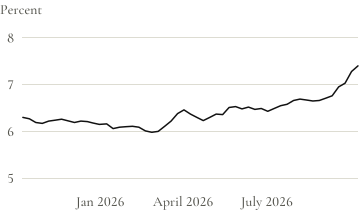
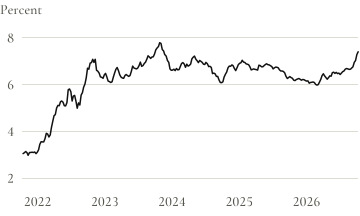
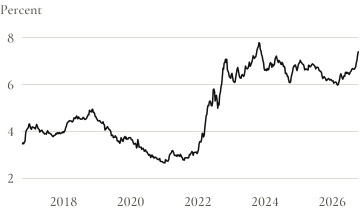
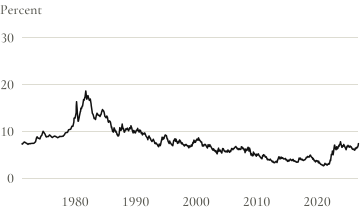
Highest since Nov 2023
7.40%
Study X
The national debt from 1790, CBO’s path for the next thirty years, and the two questions: what is wasted, and who pays.
Study XII
What the federal government pays to carry its debt, what makes it grow, and which levers stop it.
Study XI
What a $5,000 check to every citizen would cost, where the money would go, and what the borrowing would add.
Where the money comes from, where it goes, and who decides.
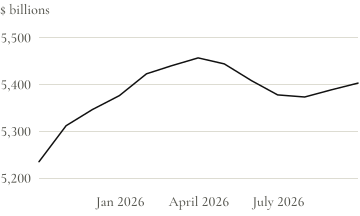
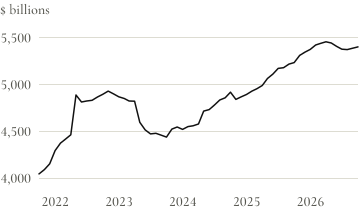
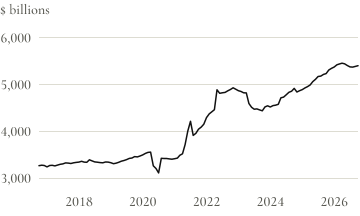
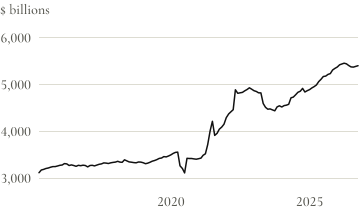
Up $168.1 billion in a year
$5,403.3 billion
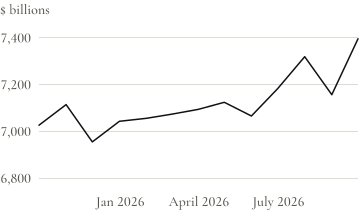
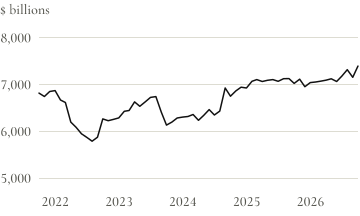
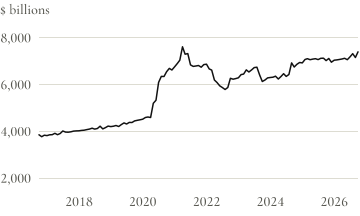
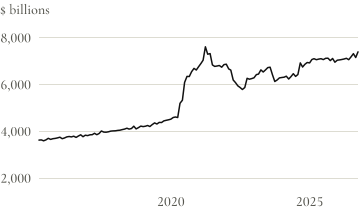
Highest since March 2021
$7,395.8 billion
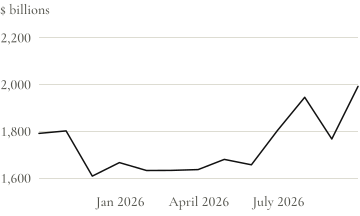
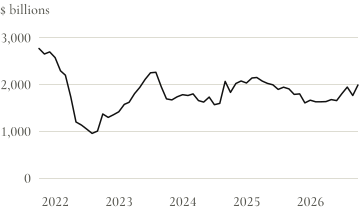
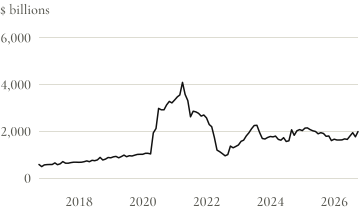
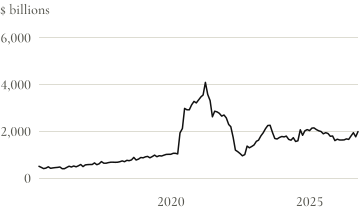
Highest since May 2025
$1,992.5 billion
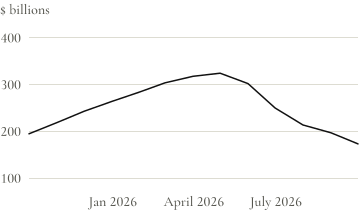
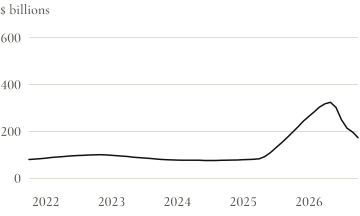
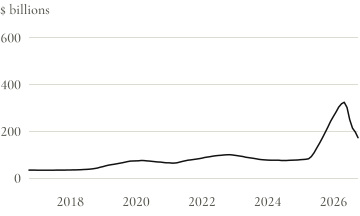
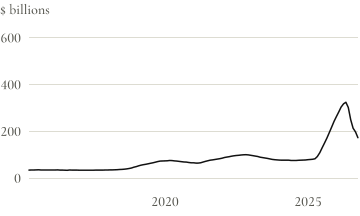
Lowest since Aug 2025
$173.2 billion
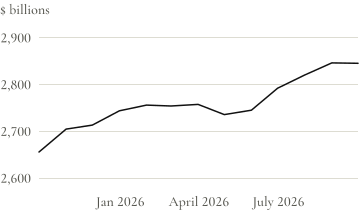
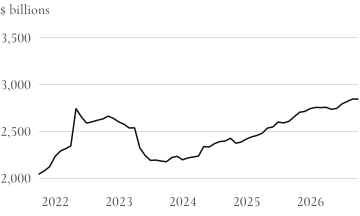
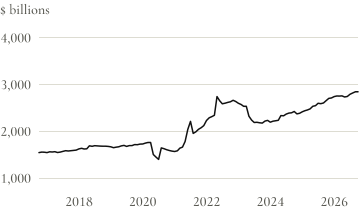
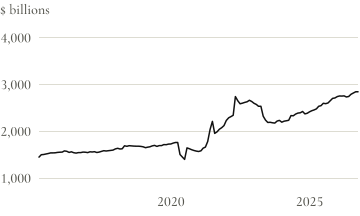
Up $189.5 billion in a year
$2,845.5 billion
Down $70.7 billion in a year
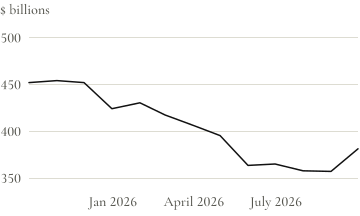
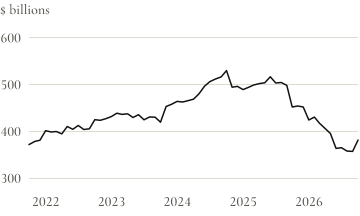
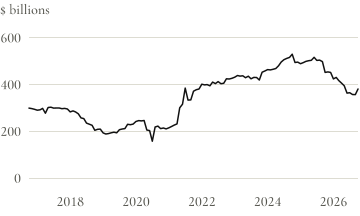
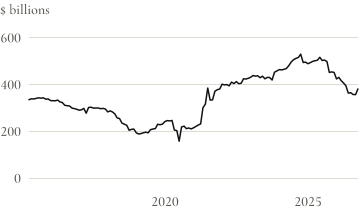
$381.4 billion
Study IV
Where $7.01 trillion came from and went in fiscal 2025, traced to the account and back through the century.
Study V · Part One
FY2025’s 1,312 accounts and five years of receipts: what the money buys, where it lands and the lobbying around it.
Study V · Part Two
FY2025’s $9.8 trillion, four ways: money out by purpose, money in by tax, benefits by state and income, and the whole ledger.
Study IX
Defense, veterans and the world since 1940, per resident and in fiscal 2025 dollars, and what it bought.
How the economy is measured, and why the official numbers disagree.
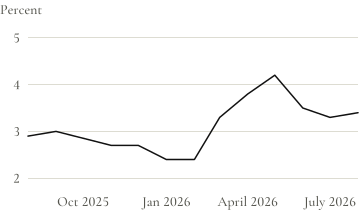
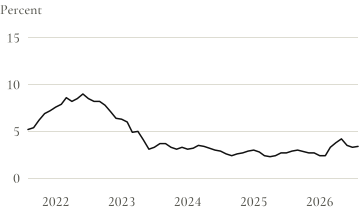
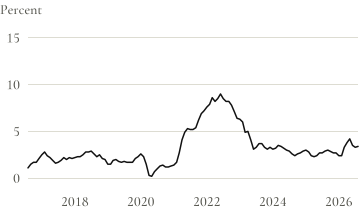
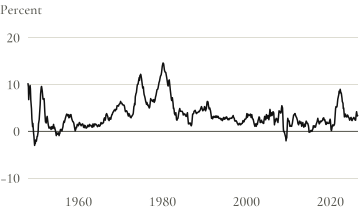
Up 0.5 points in a year
3.4%
Down 0.2 points in a year
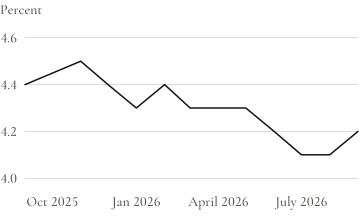
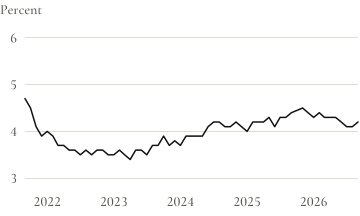
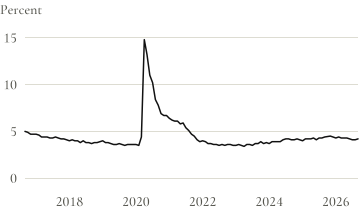
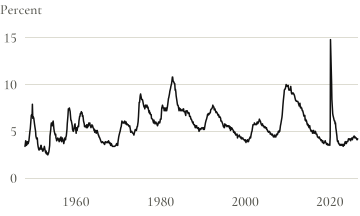
4.2%
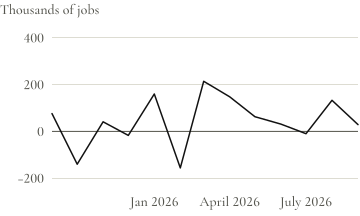
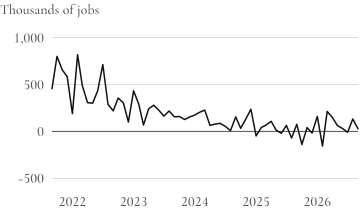
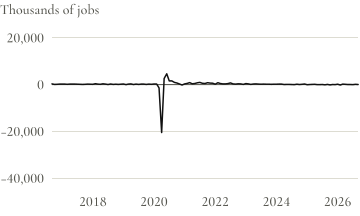
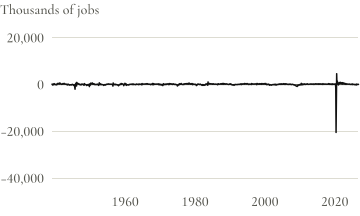
Down from +76,000 a year earlier
+29,000 jobs
Down from 4.0% a year earlier
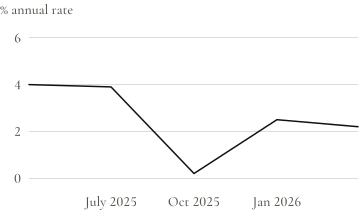
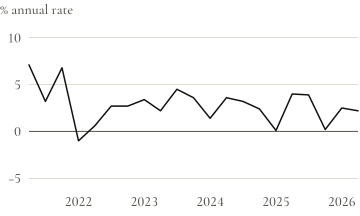
2.2% annual rate
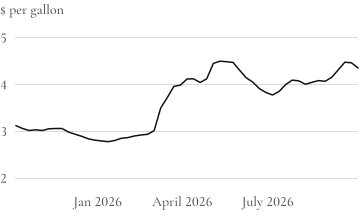
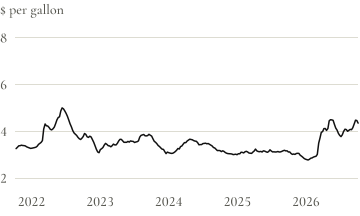
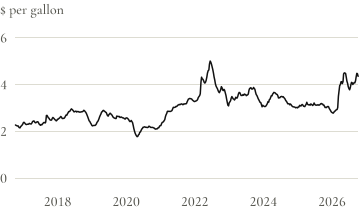
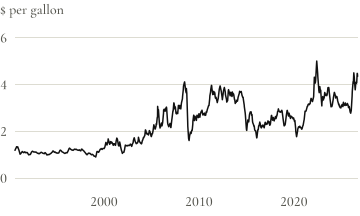
Up $1.236 in a year
$4.354 a gallon
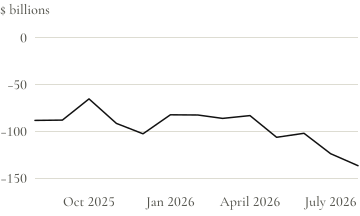
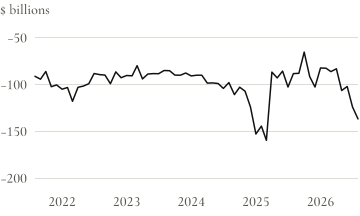
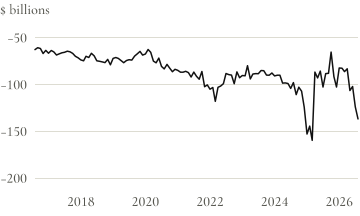
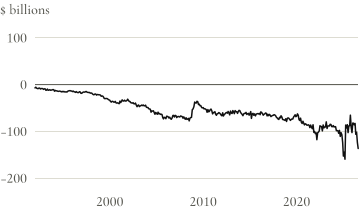
Lowest since March 2025
−$136.6 billion
Study I
Nine published measures of inflation: in July 2026 they disagreed by 1.22 percentage points.
Study II
In nearly every year since 1948 the Joint Economic Committee has bound the majority’s and minority’s accounts into one document.
Study III
Four credible estimates give four answers to one question, and in every case the gap has a documented cause.
What each state gets from Washington, what it raises itself and what it keeps in reserve.
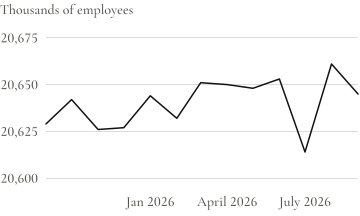
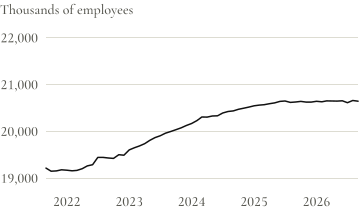
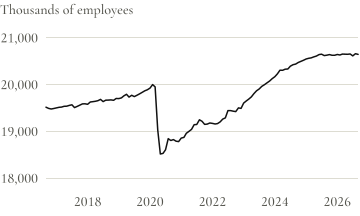
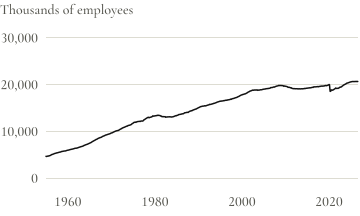
Up 16,000 in a year
20,645,000 jobs
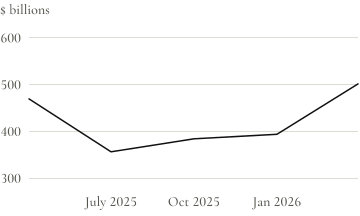
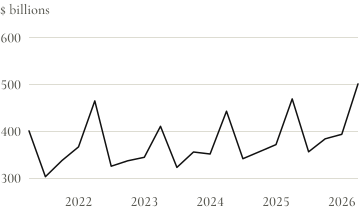
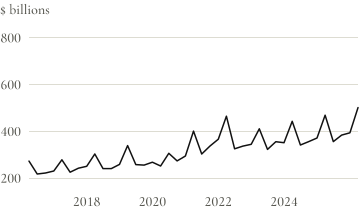
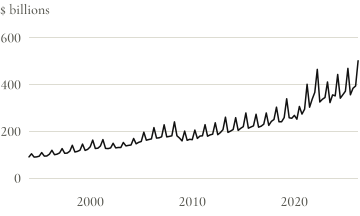
Highest in data back to 1994
$501.5 billion
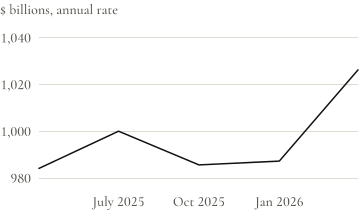
Highest since Q3 2021
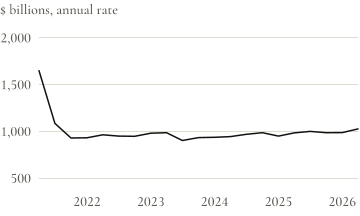
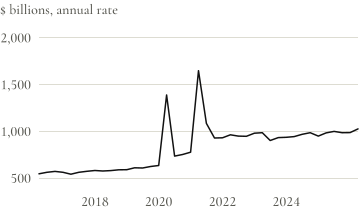
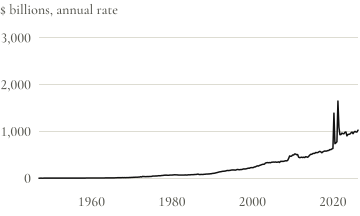
$1,026.3 billion, annual rate
Lowest since April 2020
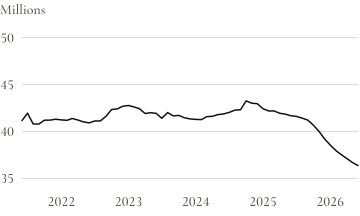
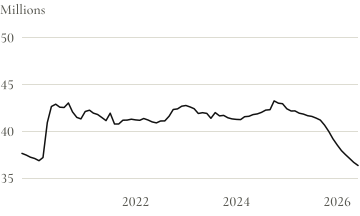
65.97 million people
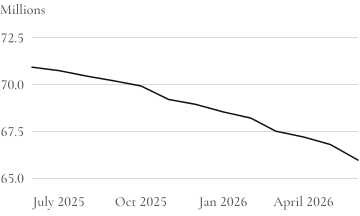
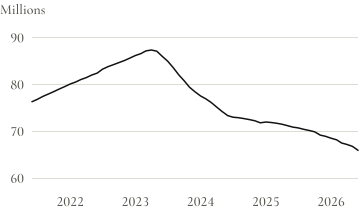
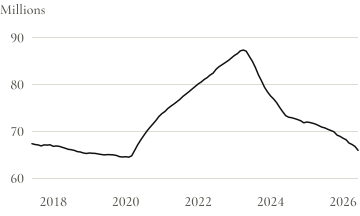
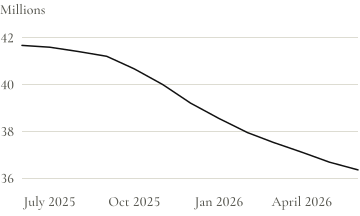
Lowest in data back to 2019
36.35 million people
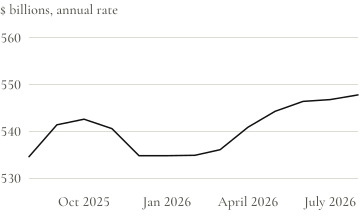
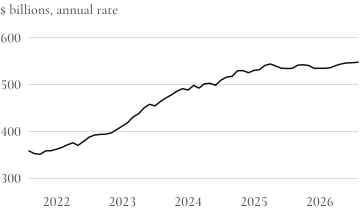
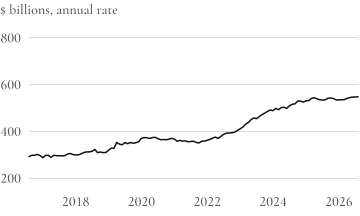
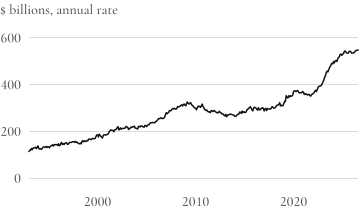
Highest in data back to 1993
$547.8 billion, annual rate
Study V · Part Three
What each state is recorded as receiving since FY2014, and why $1.16 trillion of FY2025 Medicare is booked to the payee’s state.
Study XIX · New
Federal money was 34% of state general revenue in fiscal 2024: what it pays for, what the 2025 law shifts and what states hold.
Federal money, federal jobs and federal rules where they land: Maryland, Virginia, the District and the Bay.
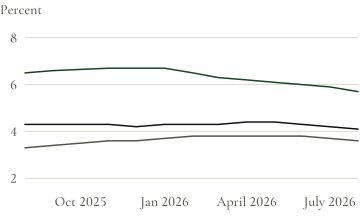
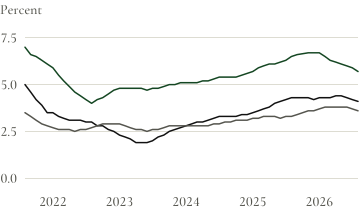
D.C. lowest since Jan 2025
D.C. 5.7% Md. 4.1% Va. 3.6%
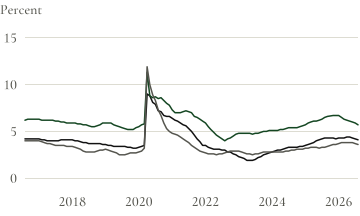
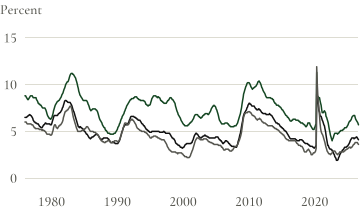
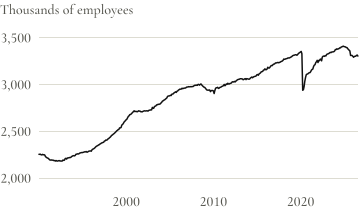
Lowest in data back to 1990
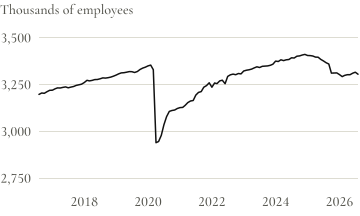
311,900 jobs
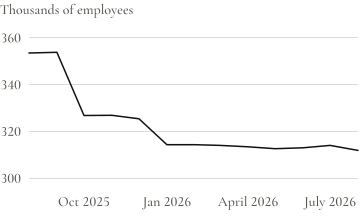
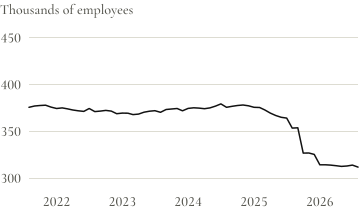
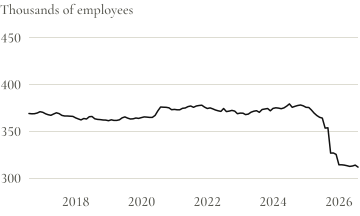
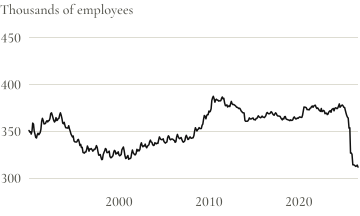
Down 61,900 in a year
3,305,300 jobs
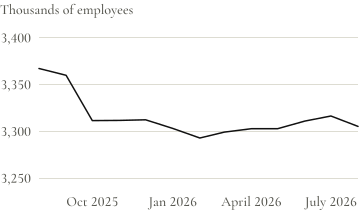
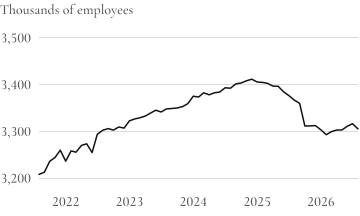
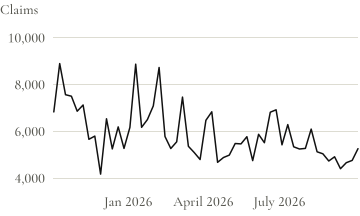
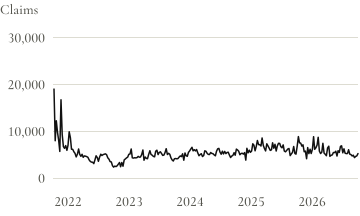
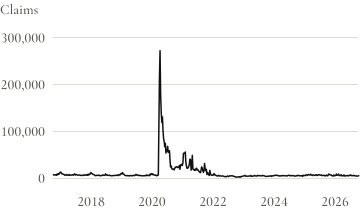
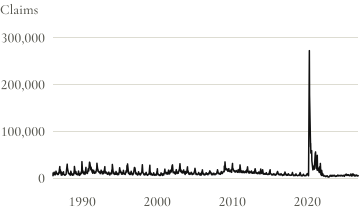
Up 119 claims in a year
5,259 claims
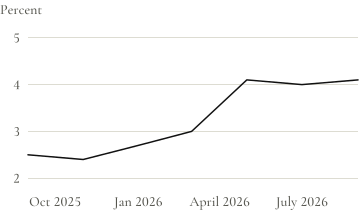
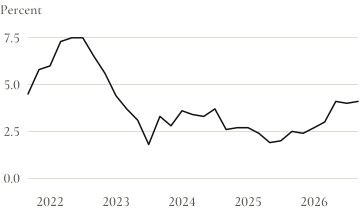
Up 1.6 points in a year
4.1%
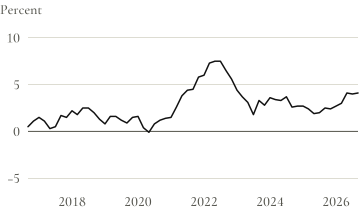
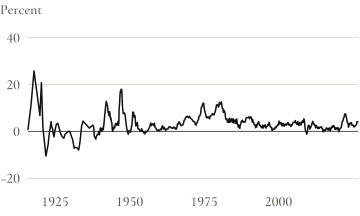
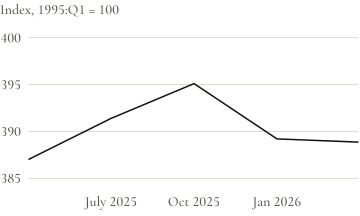
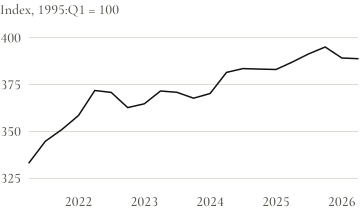
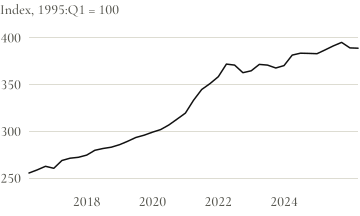
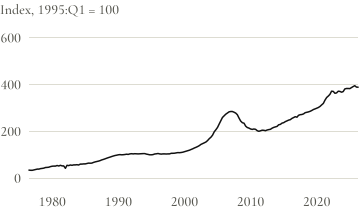
Lowest since Q2 2025
388.9 index
Study VIII
What happened to the federal payroll in Washington, Maryland and Virginia between January 2025 and August 2026.
Study VII
About two billion dollars a year moves through the Chesapeake restoration: where it comes from, who holds it, who gets the work.
Study VI
What is kept out of the Chesapeake Bay, what still gets in and what each pound costs: 57 percent of the way to the nitrogen goal.
Study XVIII · New
Federal agencies and the armed forces produced 28% of the District’s GDP in 2025: what the three economies make, earn and export.
Who works for it, what Congress ran on, and what it did.
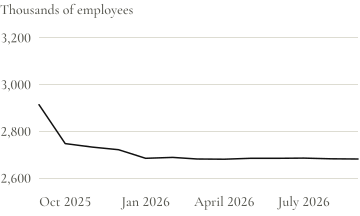
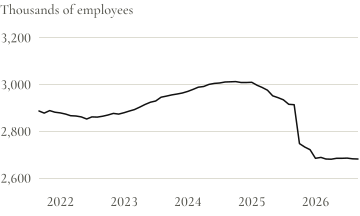
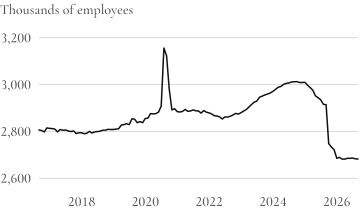
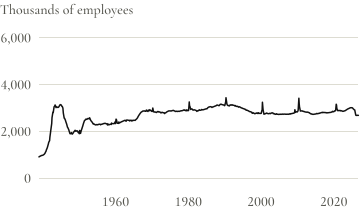
Down 232,000 in a year
2,682,000 jobs
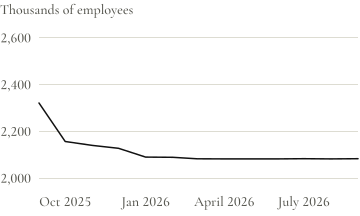
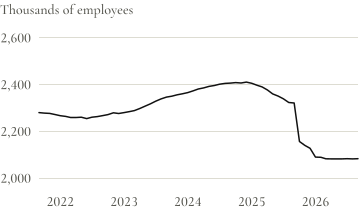
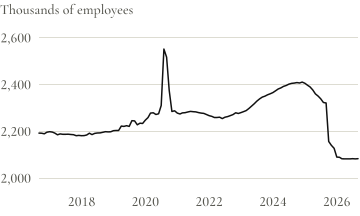
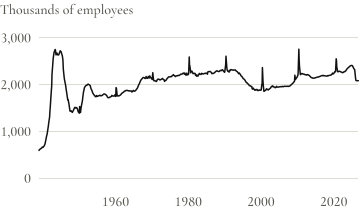
Down 238,200 in a year
2,083,300 jobs
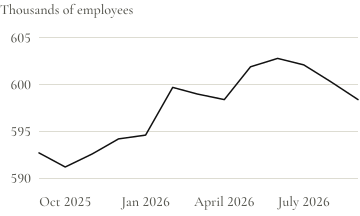
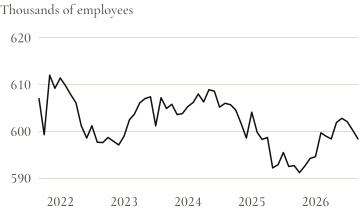
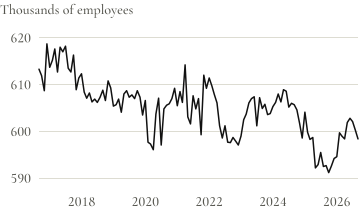
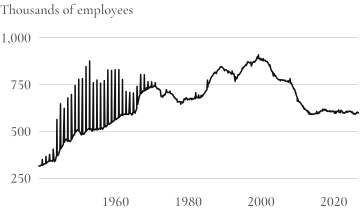
Up 5,700 in a year
598,400 jobs
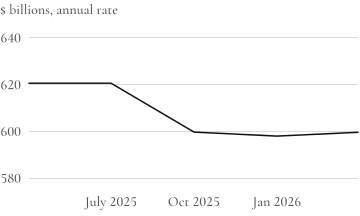
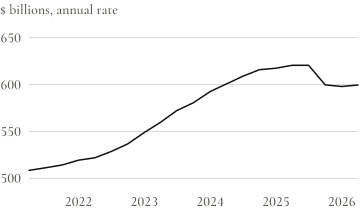
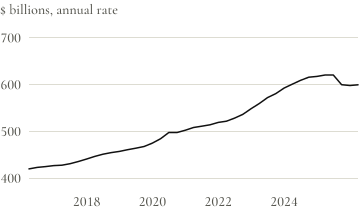
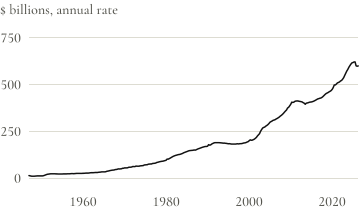
Down $21.0 billion in a year
$599.6 billion, annual rate
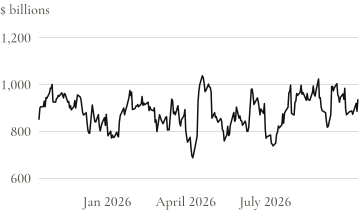
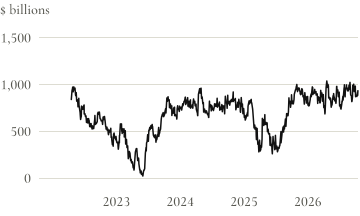
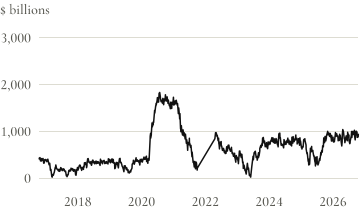
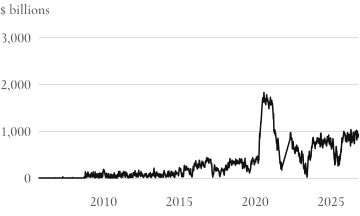
Up $83 billion in a year
$935 billion
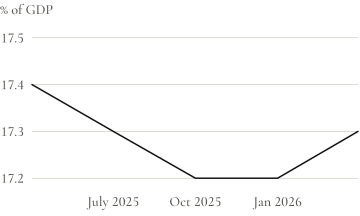
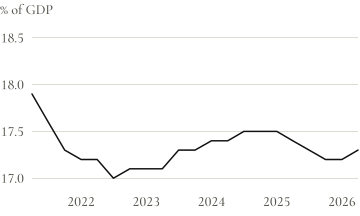
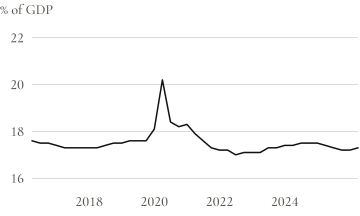
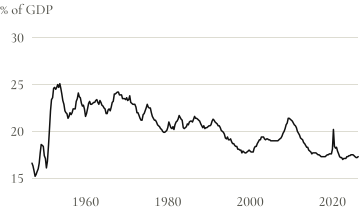
Down 0.1 points in a year
17.3% of GDP
Study VIII
Every federal civilian job shed from January 2025 to September 2026, and, through May 2026, by agency, kind and place.