The federal budget down to its 1,312 accounts: what the money buys and where it lands.
12 min read · 13 exhibits
Study IV ended at the account — the unit where an appropriation lands and a Treasury symbol is assigned — and showed that twenty of them do most of the work. This study starts there and asks the questions the account level makes answerable: which accounts moved, by how much, and why, over five years; what the receipt lines that feed them did over the same five years; what the money actually bought; where it landed; how the twelve bills that are supposed to set a quarter of it were marked and enacted for four fiscal years; who lobbies for which dollar; what Congress directed by name; and what is already promised beyond the horizon.
Two rules run through every plate. The first is about basis: account-level figures are gross outlays from USAspending, which do not sum to the $7,010.0B net total that the Monthly Treasury Statement publishes, because the budget nets out collections and because a general-fund payment into a trust fund is counted once leaving the general fund and again leaving the trust fund. Those internal transfers are hatched wherever they appear. The second is about time: Treasury counts in fiscal years, the Trustees and the lobbying registers in calendar years, and FY2026 is ten months old and not closed. No plate mixes them.
I. The map
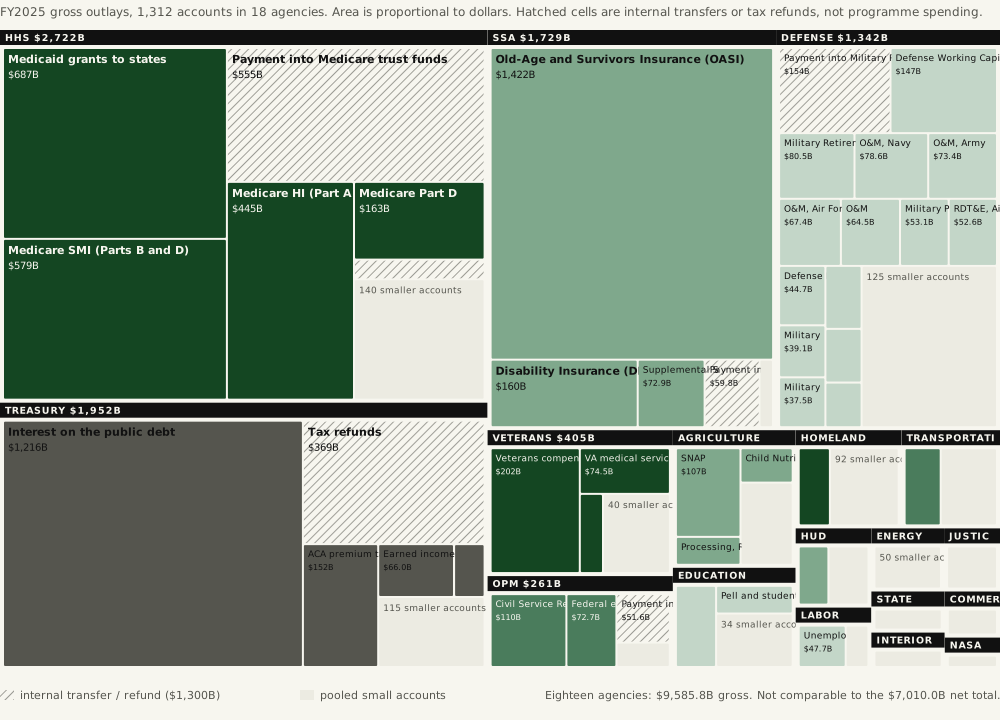
Eighteen agencies account for the bulk of federal outlays. Between them they ran 1,312 accounts in FY2025, and the shape of the map is the shape of the argument: two accounts — Social Security’s Old-Age and Survivors Insurance and interest on the public debt — are more than a quarter of it, and $1,300B of what looks like spending is money the government paid to itself.
Source. USAspending.gov API, agency federal-account endpoint (GTAS / DATA Act File B), FY2025, for HHS, Treasury, SSA, Defense, Veterans Affairs, OPM, Agriculture, Education, Homeland Security, Transportation, Labor, HUD, Energy, State, Justice, Interior, NASA and Commerce. Method. Squarified treemap; area is proportional to gross outlays. Each agency’s accounts below 0.25% of the eighteen-agency total are pooled into one pale cell with a count. Hatched cells are general-fund payments into other federal funds (Medicare, Social Security, military and civil-service retirement) and tax refunds, which the budget nets against receipts — ten accounts, $1,300.2B. Every agency-year total reconciles to the cent with the agency’s separately reported agency_total_outlayed. Data: fb5-01-account-map.csv.
II. Five years at the account level
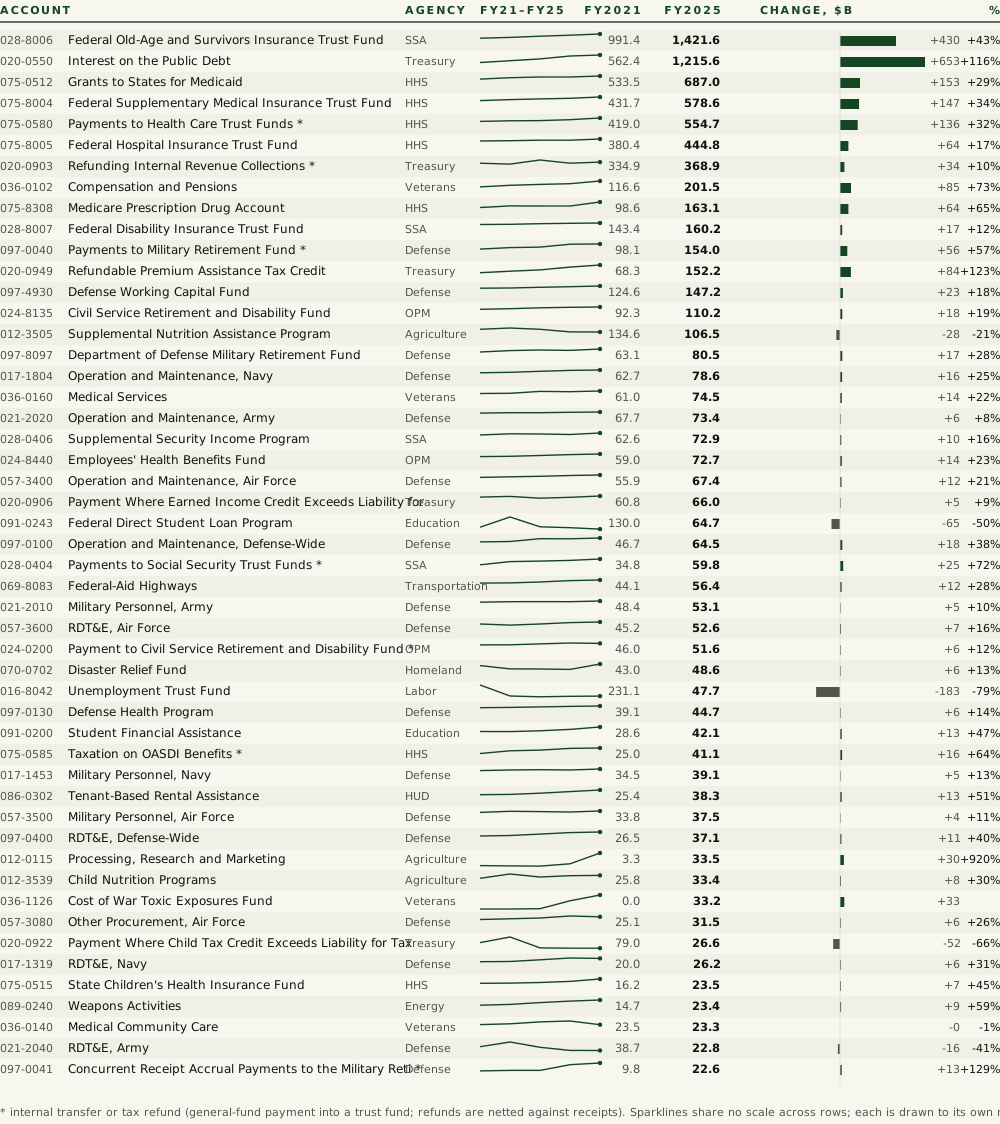
The fifty largest accounts, one row each, with the whole five-year path. Read the sparklines for shape and the last two columns for size. Three shapes recur: a steady climb (Social Security, Medicare, Medicaid, veterans, interest), a pandemic spike that collapses (unemployment, student loans, the child tax credit), and a policy step (the toxic-exposures fund, CHIPS, the ACA premium credit).
Source. USAspending.gov federal-account gross outlays, FY2021–FY2025, same eighteen agencies. Method. Ranked by FY2025 gross outlays. Each sparkline is drawn to its own maximum, so it shows shape, not size. The change bar is on one shared scale (interest on the debt, +$653B, sets it). Rows marked * are internal transfers or refunds and are shown because they are real Treasury symbols with real cash movement, not because they are programme spending. Data: fb5-02-fifty-accounts.csv.
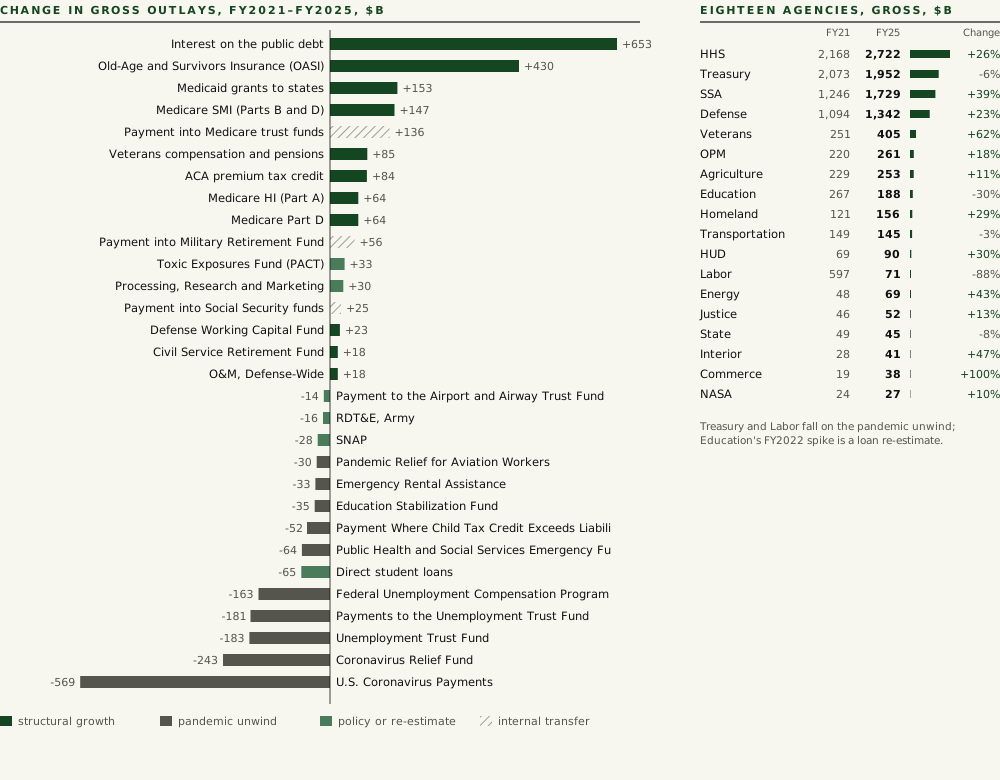
Concentrate the change into one picture and the five years have two stories, not one. Interest on the public debt rose $653B — more than the entire gross outlay of Veterans Affairs and Homeland Security together. At the other end, five pandemic accounts gave back $1,339B. Net those two against each other and the government’s outlays grew 2.8% in five years while its receipts grew 29.4%. Neither number means what it appears to mean without the decomposition.
Source. As Plate II; agency totals from the same endpoint. Method. The sixteen largest absolute increases and fourteen largest decreases in gross outlays among the eighteen agencies’ accounts, tax-refund accounts excluded. Classes are the author’s: structural for entitlement, retirement and interest accounts whose growth is set by law and demography; pandemic unwind for CARES, ARP and unemployment accounts; policy or re-estimate for the PACT Act fund, USDA’s Processing, Research and Marketing account (the 2025 farm-aid vehicle), direct student loans (credit re-estimates) and SNAP; internal transfer as in Plate I. Right panel: each agency’s gross outlays, FY2021 and FY2025. Data: fb5-03-movers.csv, fb5-03b-agency-gross.csv.
III. Every receipt line
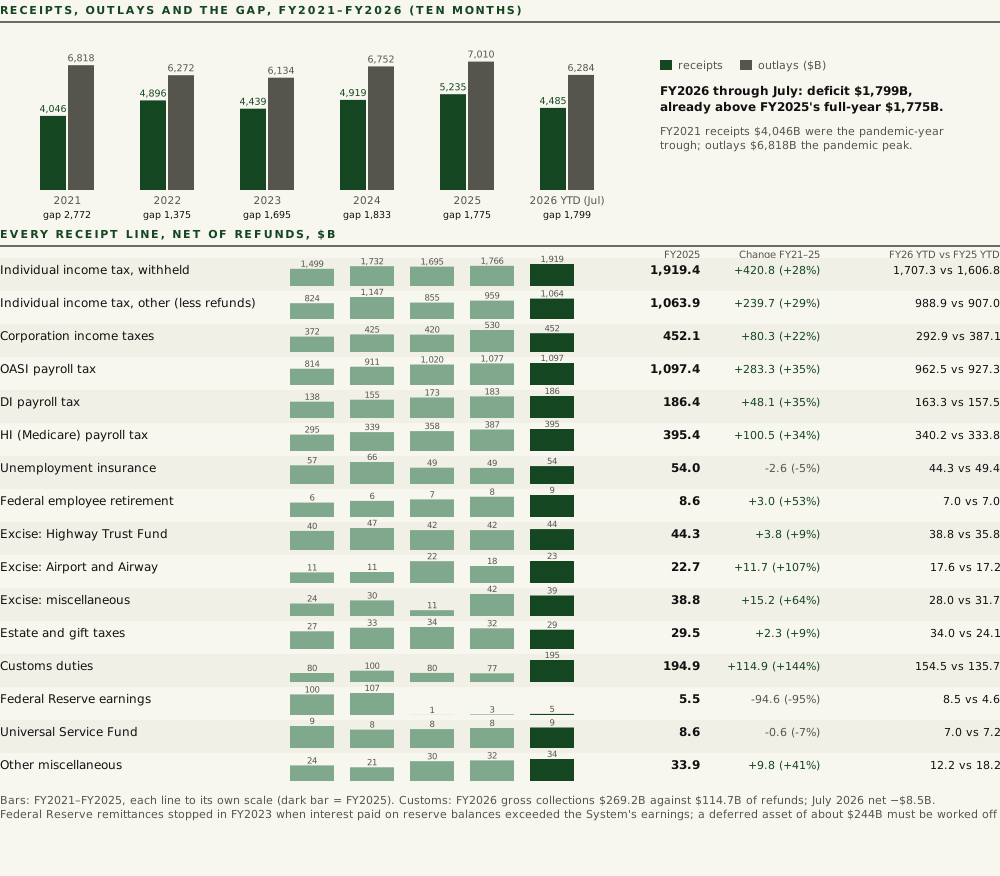
The receipt side has fifty-seven lines in Treasury’s Table 4. Sixteen of them carry the money; the rest are adjustments. Over five years the payroll taxes grew a third, the individual income tax a third, the corporate tax a fifth — and then reversed in FY2025 — and two lines moved in ways that no tax law explains: Federal Reserve remittances fell from $100B to $5B when the System’s interest expense overtook its earnings, and customs duties went from $80B to $195B, and are now being refunded at a rate that exceeded collections in July 2026.
Plate IVEvery receipt line, FY2021–FY2026 year to date
Source. Treasury, Monthly Treasury Statement, Table 4 (receipts by source) via the FiscalData API, September records for FY2021–FY2025 and the July 2026 record for FY2026 year-to-date; Table 1 for outlays and deficit. Method. Net of refunds. Each line’s five bars are on that line’s own scale; the FY2025 bar is dark. The FY2026 column is ten months and is compared only with the same ten months of FY2025, never with a full year. Receipts less outlays equals the published deficit to the cent in every year. The gross-collection and refund figures for customs are the MTS lines before netting: gross $269.2B, refunds $114.7B through July 2026, and a net −$8.55B in July alone. Data: fb5-04-receipts-lines.csv, fb5-04b-summary.csv.
IV. What it buys, and where it lands
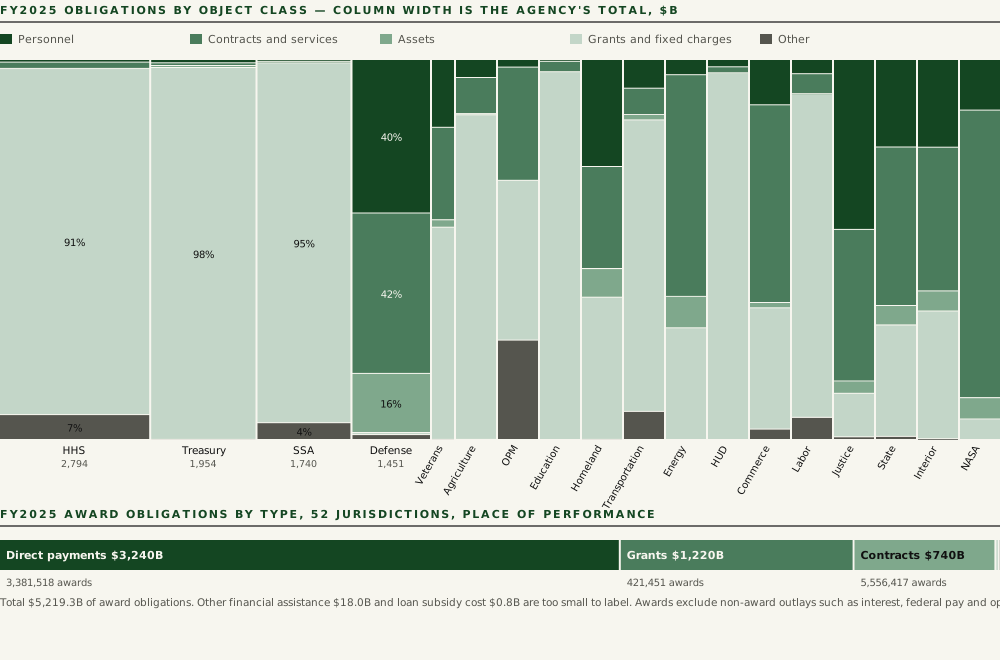
An account tells you who spends. An object class tells you what for. The federal government is two governments on this cut: one that employs people and buys things (Defense, Homeland Security, Justice, NASA) and one that writes cheques (HHS, Treasury, SSA, Education, HUD). Defense spends 40% of its obligations on people and 16% on hardware; HHS spends 0.7% on people and 91% on grants and fixed charges.
Source. USAspending.gov API, agency object-class endpoint, FY2025, eighteen agencies (GTAS File B; the live endpoint returns a flat list, and major classes were assigned per OMB Circular A-11 §83); award types from the recipient/state awards endpoint, 52 jurisdictions. Method. Marimekko: column width is the agency’s total obligations; segments are the five major object classes. Columns narrower than 34px are widened to a 34px minimum so their composition can be read, which means the twelve smallest agencies are not to width scale — their totals are in the data file. Obligations, not outlays, and gross of intragovernmental. The lower strip is award obligations by type; it excludes non-award outlays (interest, federal pay, operations). Data: fb5-05-object-class.csv, fb5-05b-award-types.csv.
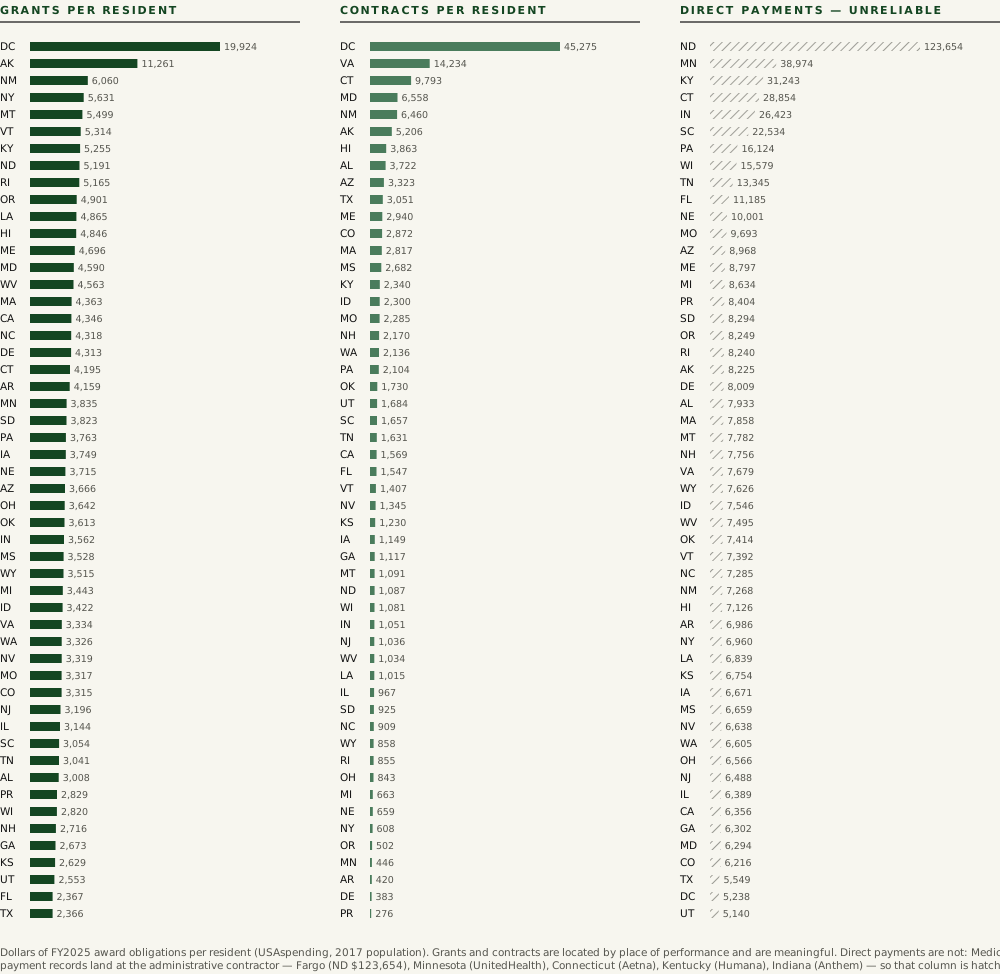
Geography is where the public data most often lies, and it is worth showing the lie. USAspending’s own per-capita figure puts North Dakota first in the nation at $130,295 per resident. Nobody in Fargo is receiving that; Medicare’s administrative contractor is. Grants and contracts are located by place of performance and can be ranked. Direct payments cannot.
Plate VIWhere awards land, and where the data lies
Source. USAspending.gov API, recipient/state and recipient/state/awards endpoints, FY2025; population is the API’s own 2017 Census figure. Method. Dollars of FY2025 award obligations per resident, by award type, ranked. The direct-payments column is hatched because Medicare aggregate payment records are located at the paying contractor — North Dakota (Noridian, Fargo), Minnesota (UnitedHealth), Connecticut (Aetna/CVS), Kentucky (Humana), Indiana (Anthem) — and the column therefore ranks payers, not residents. Recipient-level verification would require the API’s POST endpoints, which were not reachable; the explanation is the most plausible one, stated as such. Data: fb5-06-geography.csv.
V. The twelve bills, four years
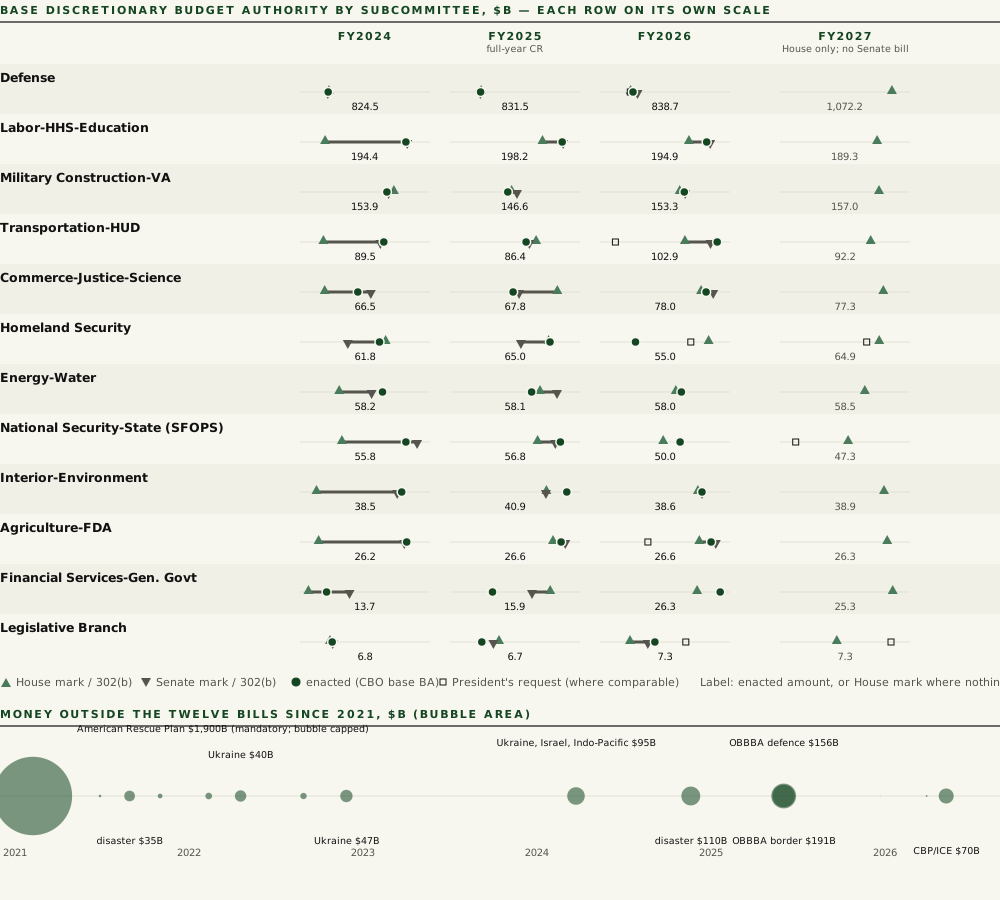
Study IV established that Congress enacted none of the twelve regular bills for FY2025. Here is what the process produced across four fiscal years, bill by bill: what the House marked, what the Senate marked, what was enacted, and what the President asked for where the request is on a comparable basis. Two things are visible at once. The House–Senate gap is routinely larger than the year-on-year change in the enacted number. And for FY2027 there is no Senate column at all: the committee postponed its June markups over the defense and non-defense topline and had reported no bill by 4 September 2026.
Plate VIIRequest, House, Senate, enacted — FY2024 to FY2027
Source. CBO, Status of Discretionary Appropriations (House and Senate editions for FY2024–FY2027) and cost estimates for P.L. 118-42, 118-47, 119-4, 119-37, 119-74, 119-75 and 119-86; House Appropriations Committee 302(b) tables and bill reports; Senate Appropriations Committee S.Rept. 118-45 and FY2025–FY2026 committee marks; CRS appropriations status reports; supplementals from CBO cost estimates and CRS IN12107, IN12274, IN12580, R48704, R48874. Method. Base discretionary budget authority in billions; enacted is CBO’s base (security plus non-security) with cap adjustments excluded; FY2025 enacted is the full-year CR level. Each row is drawn on its own scale from 90% of its minimum to 105% of its maximum, so rows are comparable in shape, not in width. Requests are shown only where a source gives a 302(b)-comparable per-bill figure. The lower strip plots each supplemental or reconciliation appropriation at its enactment date; bubble area is dollars, capped at the American Rescue Plan. Data: fb5-07-twelve-bills.csv, fb5-07b-supplementals.csv.
VI. Who lobbies for which dollar
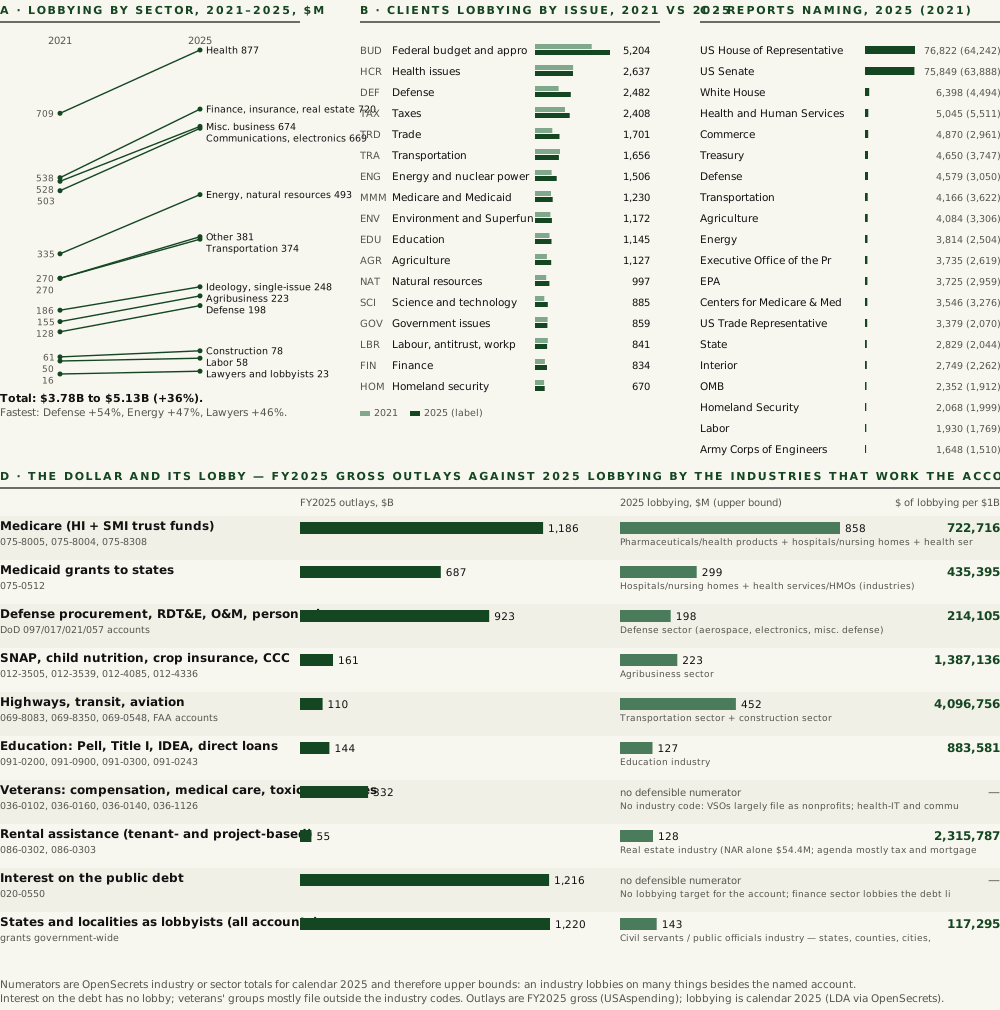
Federal lobbying reported $5.13B in 2025, a record, from $3.78B in 2021. The single most-lobbied subject in Washington is the federal budget and appropriations — 5,204 clients, up a third in four years — and the two most-named targets on every report are the House and the Senate. Map that lobbying to the accounts it works and a pattern appears that is the reverse of the account map: the biggest accounts draw the least lobbying per dollar, and the largest of all, interest on the debt, draws none.
Source. Lobbying Disclosure Act filings as compiled by OpenSecrets — sector, industry, client, issue and agency tables captured directly from opensecrets.org on 4 September 2026 (calendar years 2021–2025; 2026 through Q2); Senate LDA API for filing counts. Outlays from Plates I–II. Method. Panel A: reported lobbying spending by sector. Panel B: number of clients reporting each issue code. Panel C: number of reports naming each entity. Panel D: for each spending target, FY2025 gross outlays against the 2025 lobbying spend of the industries or sector that work that account; the ratio is an upper bound, since no dataset attributes lobbying dollars to an account and an industry lobbies on many things. Where there is no defensible numerator the cell says so. Data: fb5-08-lobbying-sectors.csv, fb5-08b-lobbying-issues.csv, fb5-08c-lobbying-agencies.csv, fb5-08d-account-lobbying-map.csv.
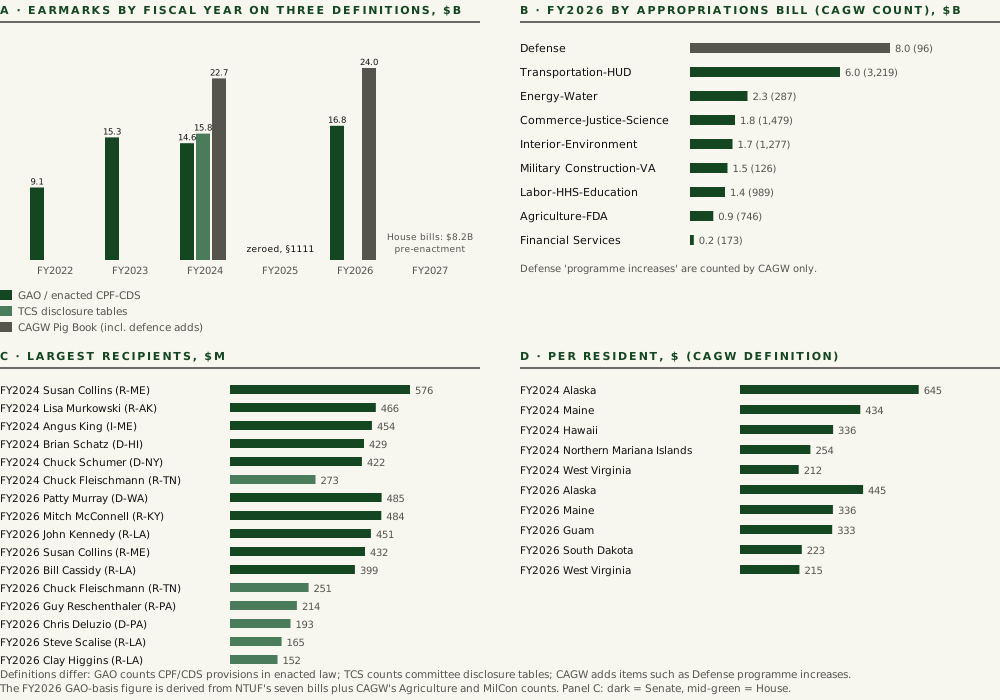
The other channel by which money is put into named accounts is the one Congress reserves for itself. Earmarks — community project funding in the House, congressionally directed spending in the Senate — returned in FY2022, reached roughly $15B a year, were zeroed for FY2025 by section 1111 of the full-year continuing resolution, and came back at roughly $17B in FY2026. What counts as an earmark depends on who is counting, and the plate shows three counts side by side rather than choosing one.
Source. GAO reports on community project funding and congressionally directed spending (FY2022–FY2024 counts and dollars); Taxpayers for Common Sense earmark database (FY2024); Citizens Against Government Waste, Congressional Pig Book (FY2024, FY2026); National Taxpayers Union Foundation FY2026 tables (seven bills); House and Senate committee disclosure tables; P.L. 119-4 §1111 for FY2025. Method. Panel A shows each source on its own definition and does not reconcile them: GAO counts CPF/CDS provisions in enacted law; TCS counts the committee disclosure tables; CAGW adds items such as Defense “programme increases” that neither chamber discloses as earmarks. The FY2026 GAO-basis bar is derived (NTUF’s seven bills plus CAGW’s Agriculture and MilCon counts) and should be replaced when GAO publishes. Data: fb5-09-earmarks-*.csv.
VII. The long funds and the horizon
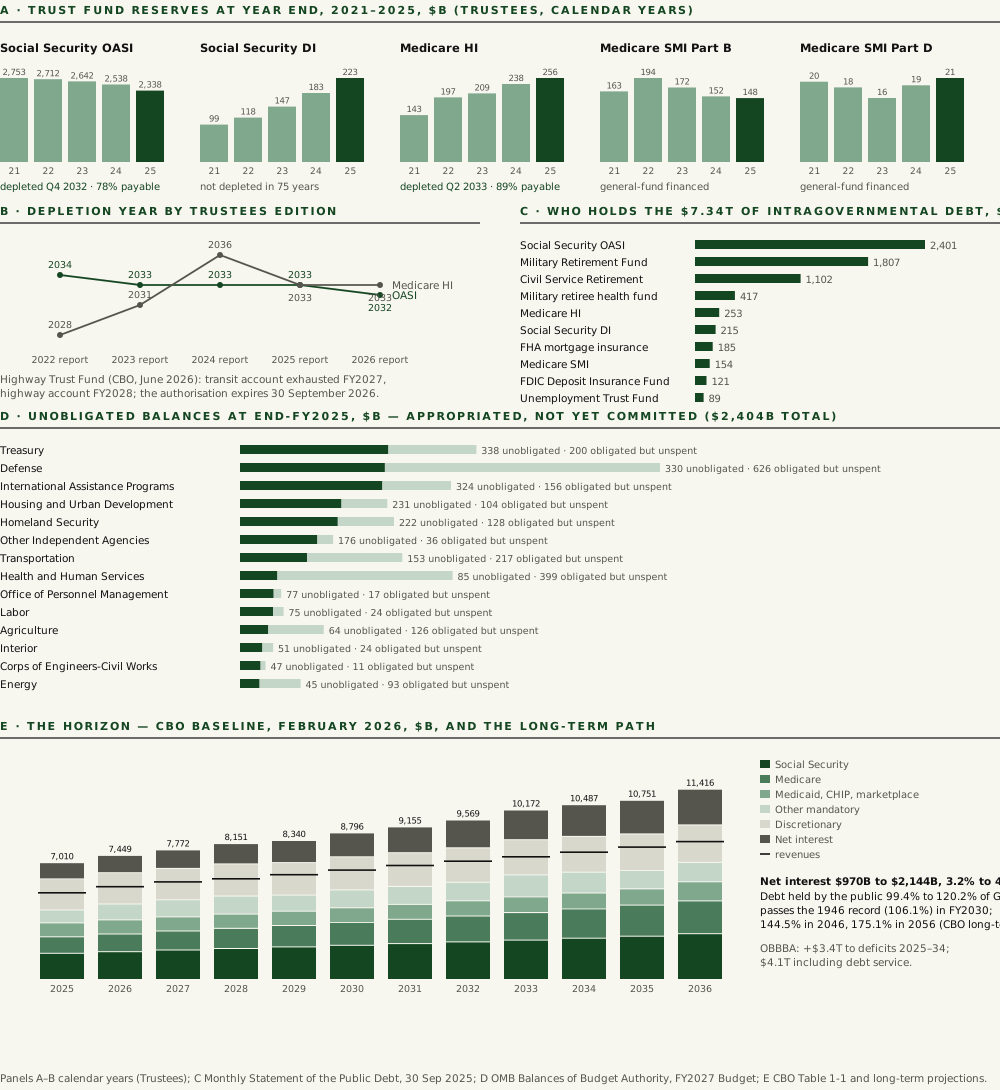
Most of the money in the account map is not decided year to year, and a large part of it is not decided at all: it flows from trust funds whose reserves are drawn down on a schedule the Trustees publish, from balances Congress appropriated years ago and has not yet spent, and from statutes whose ten-year cost is known to the billion. The plate puts those on one page: reserves and depletion dates, who holds the $7.34 trillion of debt the government owes itself, $2.4 trillion appropriated but unobligated, and CBO’s path to 2036 and beyond.
Source. 2022–2026 OASDI and Medicare Trustees Reports (Tables VI.A1–A2, II.E1, II.F1 and the highlights of each edition); CBO, Highway Trust Fund baseline projections, June 2026; Treasury, Monthly Statement of the Public Debt, Table III (Government Account Series, intragovernmental holdings, 30 September 2025) and Debt to the Penny; OMB, Balances of Budget Authority, Budget of the U.S. Government FY2027; CBO, The Budget and Economic Outlook: 2026 to 2036, Table 1-1, and CBO’s 2026 long-term budget projections data; CBO and JCT estimates of P.L. 119-21. Method. Panels A–B are calendar years; C is a point in time; D is end of fiscal year; E is fiscal years. Panel B plots the depletion year given in each successive report. Panel D stacks unobligated balances (dark) with obligated-but-unspent balances (pale) on one scale. Panel E stacks CBO’s outlay categories with the revenue line drawn across each year; the 2036–2056 figures in the note are from CBO’s long-term data, for which no narrative report was published in 2026. Data: fb5-10-trust-funds.csv, fb5-10b-depletion.csv, fb5-10c-intragovernmental.csv, fb5-10d-unobligated.csv, fb5-11-cbo-baseline.csv, fb5-11b-cbo-ltbo.csv, fb5-11c-multiyear.csv.
VIII. The flow, whole
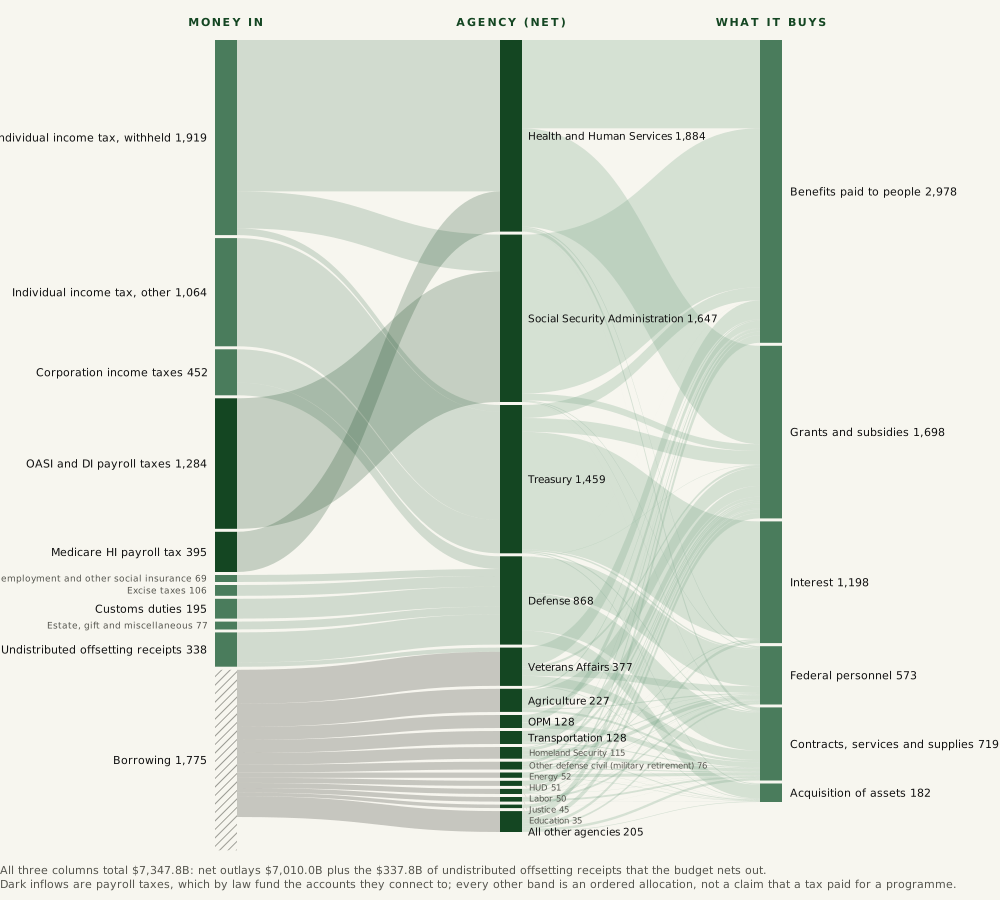
Study IV drew the flow as two columns. With the account and object-class work done, it can be drawn as three: what came in, which agency it left through on the official net basis, and what it bought. The dark inflows are the payroll taxes, which by law fund the accounts they connect to; every other band is an allocation in order, which is the honest way to say that a dollar of income tax has no destination until Congress and the permanent law give it one.
Plate XIThe flow, FY2025 — receipt line to agency to object class
Source. Treasury, Monthly Treasury Statement FY2025, Tables 4 and 5 (receipts by source; net outlays by agency, including the $337.8B of undistributed offsetting receipts); USAspending.gov object-class detail, FY2025, for the eighteen agencies (the “all other” group uses the eighteen-agency mix). Method. Three columns on one scale, each summing to $7,347.8B. Left: net receipts plus offsetting receipts plus borrowing. Middle: net outlays by agency. Right: each agency’s net outlays allocated by its own FY2025 obligation mix across six object classes, with refunds and intragovernmental financial transfers removed before normalising. Because Treasury’s obligation mix is gross of interest credited to trust funds, the interest band ($1,198B) exceeds the $970B net interest figure; read it as “interest, gross basis”. Payroll bands are legal; all other bands are ordered allocations. Data: fb5-04-receipts-lines.csv, fb5-05-object-class.csv, and net outlays by agency in the research package.
IX. The cycle
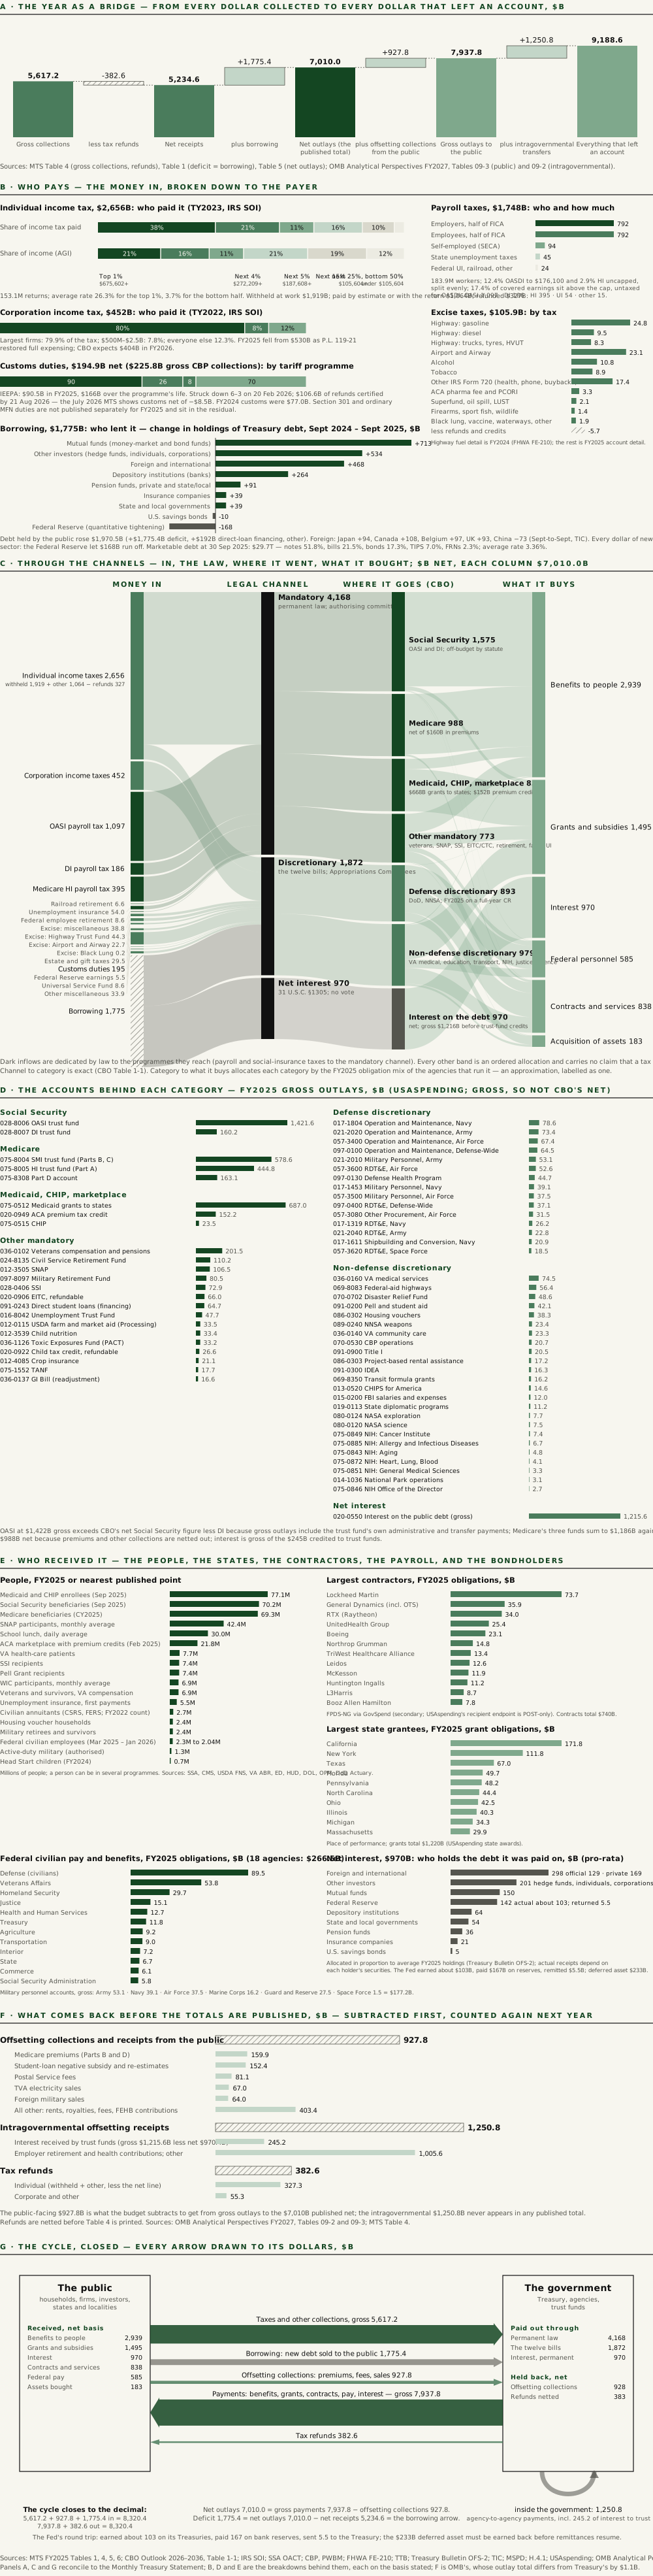
The last plate is the one Study IV said no pie chart could draw, and it is now built in seven movements. First a bridge: the year begins with $5,617B collected gross, gives back $383B in refunds, borrows $1,775B, and publishes $7,010B — but $928B more was collected from the public and netted against outlays, and $1,251B more moved between agencies, so $9,189B actually left an account. Second, who paid: the top one per cent of returns paid 38 per cent of the income tax on 21 per cent of the income and the bottom half paid 3 per cent; 4,759 firms with assets above $2.5 billion paid 80 per cent of the corporate tax; employers and employees split $1,584B of FICA to the dollar; $90.5B of the $195B in customs came from the IEEPA tariffs the Supreme Court has since struck down; and every dollar of the $1,775B borrowed was lent by the private sector — mutual funds, hedge funds and households above all — while the Federal Reserve let $168B run off. Third the channels: seventeen receipt lines enter, three legal doors let the money out — permanent law, the twelve bills, and the permanent appropriation for interest — it reaches the seven categories CBO scores, and it buys benefits, grants, interest, people, contracts and assets. Fourth the accounts: the sixty-odd Treasury accounts that carry each of those seven categories, from the OASI trust fund at $1,422B gross to the NIH institutes at a few billion each. Fifth, who received it: 77 million people on Medicaid and CHIP, 70 million on Social Security, 69 million on Medicare, 42 million on SNAP; California’s $172B of grants; Lockheed Martin’s $74B of contracts; $267B of civilian pay across eighteen agencies and $177B of military pay; and the $970B of net interest allocated to the foreigners, funds, banks and households who hold the debt. Sixth, what comes back, itemised: Medicare premiums, student-loan re-estimates, Postal fees, TVA power, foreign military sales, the interest the Treasury pays its own trust funds. Seventh, the loop closed: five arrows between the public and the government, drawn to their dollars, and they reconcile to the decimal — $8,320.4B in, $8,320.4B out. That is the cycle, and it is why the same year can be $7.0 trillion, $7.9 trillion or $9.2 trillion depending on where in it one chooses to stand.
Plate XIIThe cycle, FY2025 — the bridge, who pays, the channels, the accounts, who receives, what comes back, and the loop closed
Source. Treasury, Monthly Treasury Statement FY2025: Table 4 (gross collections, refunds, net receipts by source), Table 1 (deficit, which is the borrowing), Table 5 (net outlays) and Table 6 (debt); CBO, The Budget and Economic Outlook: 2026 to 2036, Table 1-1, FY2025 actual column; IRS Statistics of Income, individual returns by AGI percentile (TY2023) and corporation returns by asset size (TY2022); SSA Office of the Chief Actuary, covered workers, taxable maximum and the share of earnings above it; CBP monthly duty collections by programme and the Penn Wharton Budget Model tariff series (IEEPA, Section 232, Section 301); FHWA Highway Statistics table FE-210 (fuel-tax receipts, FY2024); TTB alcohol and tobacco collections; Treasury Bulletin table OFS-2 (ownership of federal securities, September 2024 and 2025); Treasury International Capital major foreign holders; Monthly Statement of the Public Debt (marketable composition, average rate); Federal Reserve H.4.1 and the Reserve Banks’ 2025 combined statements (earnings, interest on reserves, remittances, deferred asset); USAspending account-level gross outlays (File B) and object-class detail for eighteen agencies, and state place-of-performance award totals; SSA, CMS, USDA FNS, VA, Education, HUD, DOL, OPM and the DoD Actuary for beneficiary counts; FPDS-NG contractor totals via a secondary compiler; OMB, Analytical Perspectives FY2027, Chapter 9, Tables 09-2 (intragovernmental) and 09-3 (public) for offsetting collections and receipts. Method. Panel A is a bridge on one scale from gross collections ($5,617.2B) to everything that left an account ($9,188.6B); each step is a published figure or the difference of two. Panel B breaks each inflow to its payer on the basis the source publishes: income tax by percentile is tax-year, not fiscal-year, and the tariff split is CBP’s programme accounting; lenders are the change in holdings from September to September, which exceeds the deficit because direct-loan financing and cash-balance changes are also borrowed. Panel C is four columns each summing to $7,010.0B; social-insurance taxes are drawn dark to the mandatory channel because the law dedicates them, every other band is an ordered allocation with no claim that a tax paid for a programme; channel to category is exact (CBO); category to object class allocates by the FY2025 obligation mix of the agencies that run it and is an approximation, labelled as one. Panel D lists the accounts behind each category on the gross basis, so its totals exceed CBO’s net figures by the premiums, collections and intragovernmental interest that are netted out, and it says so. Panel E gives counts and dollars each on the basis stated; interest by holder is allocated pro rata to average FY2025 holdings, and the Fed’s actual round trip is shown beside its pro-rata share. Panel F itemises what the budget subtracts before any total is published; interest received by trust funds is shown inside the intragovernmental figure, not in addition to it. Panel G closes the loop: the five arrows are drawn to their dollars and reconcile exactly — $5,617.2B + $927.8B + $1,775.4B into the government equals $7,937.8B + $382.6B back out, $8,320.4B each way. Data: fb5-04-receipts-lines.csv, fb5-04b-summary.csv, fb5-11-cbo-baseline.csv, fb5-05-object-class.csv, and the cycle_in, cycle_debt and cycle_out tables in the research package.
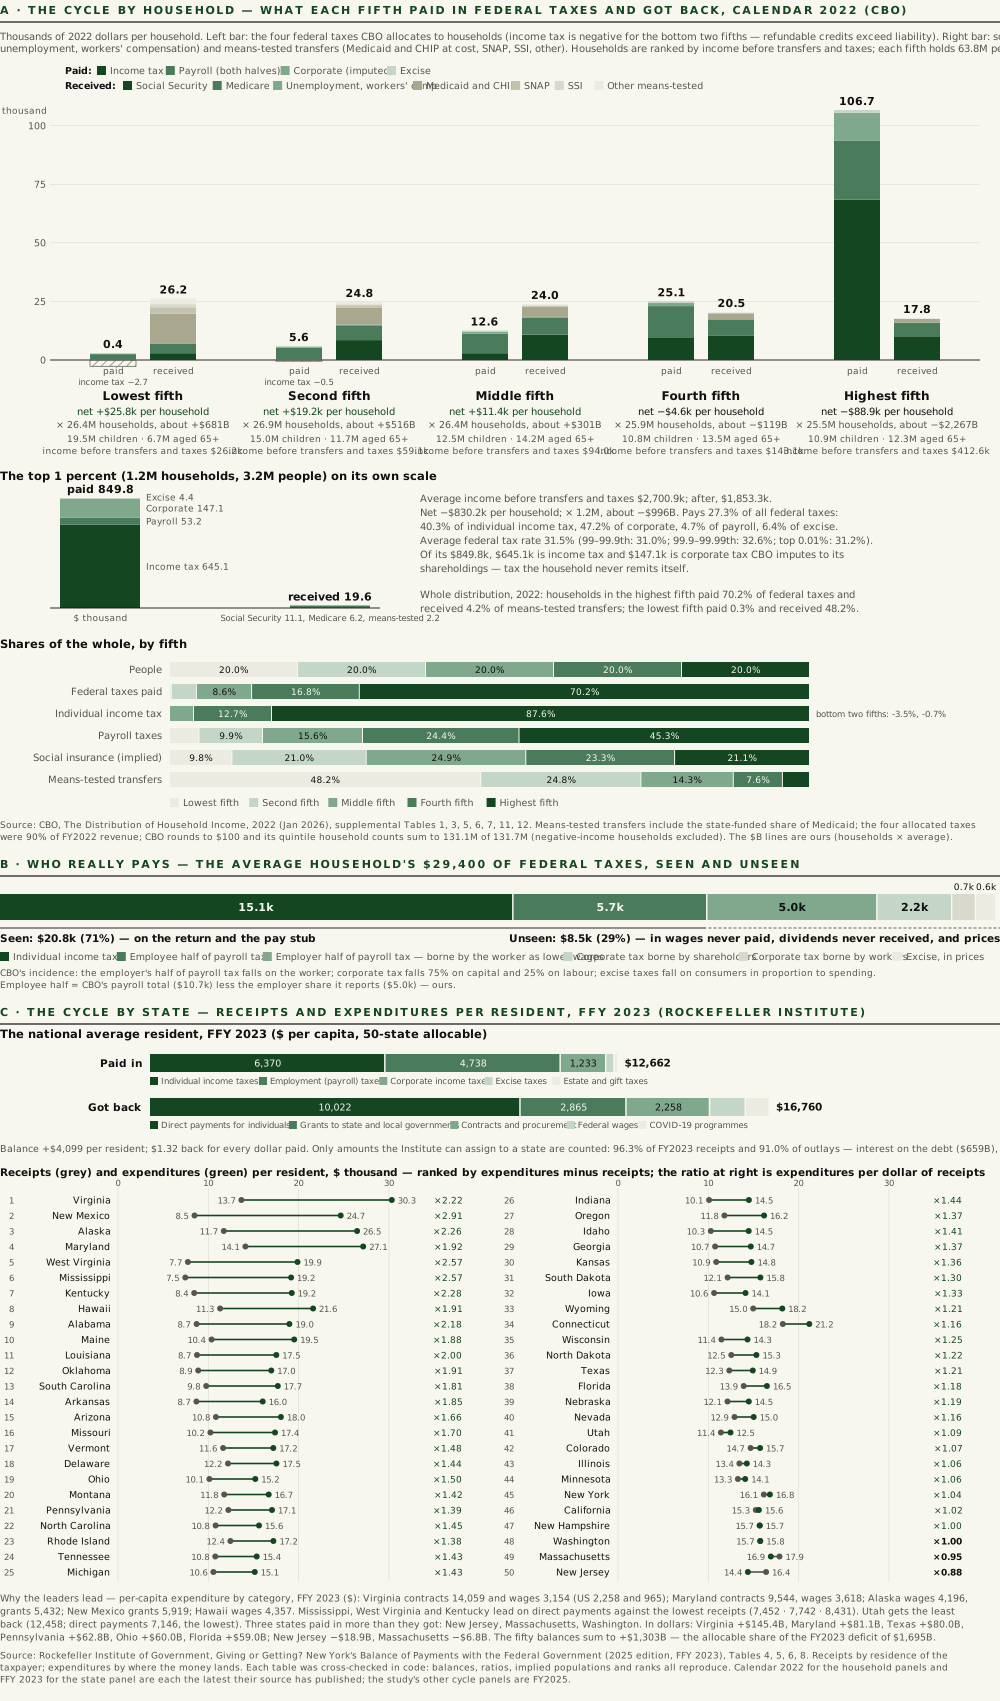
X. The cycle, from the household and from the state
Plate XII follows the dollar through the Treasury. Plate XIII stands outside it and asks the two questions the Treasury tables cannot answer: which households the cycle takes from and gives to, and which states. The first is CBO’s work and the latest year is calendar 2022. Rank households by income and cut them into fifths, and the lowest fifth paid $400 in federal taxes per household — its income tax was minus $2,700, refundable credits exceeding liability — and received $26,200 in social insurance and means-tested transfers: $7,200 of Social Security and Medicare, $12,600 of Medicaid and CHIP at cost, $2,700 of SNAP. The highest fifth paid $106,700 and received $17,800, almost all of it Social Security and Medicare. Net, the bottom three fifths took $1.5 trillion out of the cycle and the top two put $2.4 trillion in; the top one per cent alone, 1.2 million households, paid $850,000 each, $147,000 of it corporate tax imputed to their shareholdings, and put in a trillion dollars. CBO’s incidence rules are the second finding: 29 per cent of the average household’s $29,400 in federal taxes never appears on anything it signs — the employer half of the payroll tax, borne as wages not paid; the corporate tax, borne as dividends not received and wages not paid; the excise taxes, borne in prices. The second question is the Rockefeller Institute’s, and the latest year is federal fiscal 2023. Assign 96 per cent of receipts to the residents who paid them and 91 per cent of outlays to the places where they landed, and forty-seven states got back more than they paid in. Virginia got $2.22 per dollar and Maryland $1.92, because of contracts and federal wages; New Mexico $2.91, Alaska $2.26 and Hawaii $1.91 because of grants and wages; Mississippi, West Virginia and Kentucky between $2.28 and $2.57 because direct payments met the lowest receipts in the country. New Jersey, Massachusetts and Washington were the three that paid in more than they got. The fifty balances sum to $1,303 billion, which is the allocable part of the year’s deficit: what the states got back that nobody paid for was borrowed, and Plate XII shows from whom.
Plate XIIIThe cycle by household and by state — who it takes from, who it gives to, and what nobody sees
Source. CBO, The Distribution of Household Income, 2022 (January 2026), supplemental data Tables 1 (demographics), 3 (average income by source), 5 (components of income before transfers and taxes, including the incidence lines), 6 (means-tested transfers by programme), 7 (federal taxes by type), 11 and 12 (shares), and the data underlying Figures 11–16; Rockefeller Institute of Government, Giving or Getting? New York’s Balance of Payments with the Federal Government, 2025 edition (FFY 2023), Tables 4, 5, 6 and 8; Monthly Treasury Statement, September 2023, for the totals the state figures are compared with. Method. Panel A: households ranked by size-adjusted income before transfers and taxes, so each fifth holds the same number of people (63.8M), not households; the taxes are the four CBO allocates — individual income, both halves of payroll, corporate and excise — on a calendar-year liability basis, and were 90% of FY2022 revenue; the receipts are social insurance (Social Security, Medicare, unemployment insurance, workers’ compensation) plus means-tested transfers valued at government cost, which include the state-funded share of Medicaid. The per-household figures and shares are CBO’s; the $B lines are ours (households × average) and are indicative: 131.7M × $29,400 is $3.87T against $4.63T actually collected from the four taxes in FY2022, the difference being rounding, the household universe, liability timing and the calendar–fiscal offset. Panel B applies CBO’s incidence assumptions to the average household: employer payroll to the worker, corporate tax 75/25 to capital and labour, excise to consumers; the employee half is CBO’s payroll total less the employer share it reports. Panel C: receipts by residence of the taxpayer, expenditures by where the money lands, as the Institute allocates them; interest on the debt, international spending and the District of Columbia are not allocated. The two state tables were transcribed independently and cross-checked in code — for all fifty states expenditures less receipts equals the balance in dollars and per capita, the ratios reproduce, the populations implied by the three columns agree within 0.2%, and both rank orders reproduce — and the category lines of Table 8 sum to their totals within a dollar. Calendar 2022 and FFY 2023 are each the latest their source has published; the other cycle panels are FY2025. Data: household_cycle_cy2022.csv, state_balance_ffy2023.csv, us_per_capita_composition_ffy2023.csv, state_expenditure_categories_ffy2023.csv in the research package (cycle_household, cycle_geo).
What the map says
Put the thirteen plates together. The federal government’s money is concentrated in a handful of accounts whose growth is set by demography and interest rates, not by appropriation; the twelve bills that Congress fights over decide the shape of a quarter of the whole and, in three of the last four years, did not decide even that on time. The lobby follows the decidable dollar, not the large one: the most lobbying per dollar attaches to the small discretionary accounts — highways, housing, nutrition — and the least to Medicare and Social Security, and none at all to the largest single mover of the five years, interest. Congress’s own instrument for directing money by name, the earmark, is at most $17B a year against $7 trillion, and was switched off entirely for one of the five years by a formula extending the previous year.
And the horizon is already written. The reserves that pay Social Security retirement benefits are on a published path to Q4 2032; Medicare’s hospital fund to 2033; the Highway Trust Fund’s transit account to FY2027. $2.4 trillion is appropriated and waiting. CBO’s baseline carries net interest past $2 trillion in 2035 and debt held by the public past the 1946 record in FY2030. None of that appears in any pie chart of federal spending, and none of it can.
And the cycle has a shape when it is seen from outside the Treasury. It takes from the top two fifths of households and from three states, and it gives to the bottom three fifths and to forty-seven states, and the part of what it gives that nobody paid for — $1.3 trillion in FFY 2023 — it borrows, largely from the same top fifth that pays the taxes, who are then paid interest on it. The redistribution is real, it is large, and a third of what funds it is invisible to the people who fund it.
The account is where the money is. The appropriation is where the argument is. They are, increasingly, different places.
What we could not verify
Lobbying dollars by account. No public dataset attributes lobbying spending to an appropriations account. Plate VIII’s ratios use industry or sector totals as numerators and are upper bounds by construction. OpenSecrets industry pages beyond pharmaceuticals, hospitals and defence electronics were not captured before the site began rate-limiting on 4 September 2026; agribusiness, construction and real-estate targets therefore use sector totals.
Geography. The Medicare-contractor explanation for the direct-payment outliers is the most plausible reading of the data and is stated as such; recipient-level verification requires the POST endpoints, which were not reachable.
Earmark totals differ by definition and are shown unreconciled. The FY2026 government-wide figure is derived from NTUF and CAGW counts pending GAO.
The President’s per-bill requests on a 302(b)-comparable basis were obtained for only a few bills; OMB’s Historical Tables are published as spreadsheets and could not be read, so the discretionary toplines for FY2015–FY2018 are not used.
The FY2027 continuing resolution (reported as P.L. 119-103, signed 2 September 2026) was not yet on GovInfo when checked.
Trustees and CBO disagree on Medicare HI: the Trustees deplete it in Q2 2033; CBO’s February 2026 data shows $209.8B still in the fund at end-FY2036. Both are recorded; the Trustees’ date is charted.
Excise detail below the four MTS lines (alcohol, tobacco) does not exist in the MTS. Medicare historical tables: a first machine extraction was found to be fabricated and was discarded; the figures used were re-read from Tables II.E1 and II.F1 with roll-forwards verified.
Plate XII’s payer and recipient breakdowns mix bases by necessity: income-tax shares are tax-year 2023 and corporate shares tax-year 2022, the customs split is CBP programme accounting against a Treasury net figure, contractor totals come from a secondary FPDS-NG compiler because USAspending’s recipient endpoint is POST-only, and interest by holder is a pro-rata allocation, not a payment record. Each is labelled on the plate.
Plate XIII is two different years and two different universes. CBO’s household figures are calendar 2022 and allocate 90% of federal revenue; the transfers they count include state Medicaid money. The Rockefeller state figures are federal fiscal 2023 and allocate 96% of receipts and 91% of outlays; the report’s own national per-capita line ($12,662 paid, $16,760 received) does not reconcile exactly to its state table divided by the population that table implies ($12,725 and $16,603), and the plate says which figure it uses where. Neither source has published a later year. The $B aggregates by fifth are ours and are labelled as such.
FY2026 actuals do not exist. Every FY2026 figure is ten months, contains a 43-day shutdown, the FY2026 rescissions and the tariff-refund flow.
One reconciliation we can state exactly. Across all thirty agency-years in Plates I–III, the sum of account-level gross outlays equals the agency total from a separately fetched endpoint to the cent, with one exception: Transportation FY2025 moved by $56 thousand between two calls on the same day, a live revision of the Federal-Aid Highways account.
Sources
Four hundred and seventy-five distinct primary and secondary documents were used. The full list, grouped by institution with what was taken from each, is published alongside this study as Study V — SourcesStatus of Discretionary Appropriations, cost estimates for every appropriations act FY2024–FY2027, the February 2026 Budget and Economic Outlook, the June 2026 Highway Trust Fund baseline and the 2026 long-term projections; OMB’s FY2027 Budget (Balances of Budget Authority, Analytical Perspectives); the 2022–2026 Social Security and Medicare Trustees Reports; CRS reports R48176, R48517, R48564, R48704, R48874, R48968, R48970, IN12107, IN12274, IN12580 and the appropriations status series; GAO-26-108434 and the GAO community-project-funding reports; JCT’s estimates of P.L. 119-21; the House and Senate Appropriations Committees’ 302(b) tables, bill reports and disclosure tables; the Joint Economic Committee’s 2025–2026 releases on receipts, tariffs and interest; the Senate LDA database and OpenSecrets; CBO’s Distribution of Household Income, 2022 and the Rockefeller Institute’s 2025 balance-of-payments report for Plate XIII; Taxpayers for Common Sense, Citizens Against Government Waste and the National Taxpayers Union Foundation for earmarks.