Study VI · The Capital Region
Every Pound of Nitrogen
How much nitrogen is kept out of the Chesapeake Bay, how much still gets in and what each pound costs.
IThe argument
The Chesapeake Bay restoration is the largest water-quality experiment ever run in the United States, and its central result is now in. The deadline set in 2010 — every practice in place by 2025 — passed with nitrogen at 57 percent of goal, phosphorus at 90 percent, and sediment at 100 percent. On 2 December 2025 the deadline was moved to 2040. That is not a failure of effort or of money; roughly two billion dollars a year moves through the program. It is a failure of allocation, and the ledger that follows shows where.
Four facts organise everything below. First, since 2009 wastewater treatment plants delivered 64 percent of all nitrogen reductions and 61 percent of phosphorus reductions, at roughly forty dollars a pound; that work is finished, and Maryland's 66 upgraded plants alone now keep 11.7 million pounds of nitrogen a year out of the water — as much as the State's entire credited reduction since 2009. Second, the sector that is growing, runoff from developed land, is being treated with the most expensive practices in the catalogue: the median Maryland stormwater retrofit removes a pound of nitrogen for $1,558 a year, the median Maryland farm practice for $16 — a hundredfold gap measured by the same university on the same invoices, and confirmed by EPA's own program office at $2,259 against $24. Third, the watershed adds about 13,000 acres of pavement a year; Maryland's ten largest jurisdictions, spending more than $950 million over their permit terms, treat about 3,900 a year. Fourth, the remaining nitrogen gap is not everywhere: it is 33 million pounds, and on the last full accounting Pennsylvania alone was 29 million pounds short while Maryland's whole shortfall sat on the Eastern Shore, in nine agricultural counties.
The conclusion is uncomfortable for a region whose stormwater industry, our own included, has been built on the retrofit. Measured by the Bay, the next dollar belongs on a Pennsylvania or Eastern Shore farm, in a septic tank, or in the air. Measured by the neighbourhood, the stormwater retrofit still earns its keep — for flooding, stream stability and local rivers, and increasingly for rainfall that the models say will come 11 to 19 percent harder — but not for the Bay's nitrogen ledger. Programs that keep pretending otherwise will keep buying the least nitrogen per dollar in the watershed, and the deadline will move again. The scientists who wrote the program's own 2023 evaluation put the pace of improvement at a quarter of a percentage point of the Bay a year; at that rate the standards are three and a half centuries away.
IIThe water
The Bay holds about 18 trillion gallons and receives about 51 billion gallons of fresh water a day — 18.6 trillion a year, so the estuary turns over roughly its own volume annually. Half arrives down the Susquehanna; the Susquehanna, Potomac and James together carry more than 80 percent. The land draining to it covers 64,000 square miles in six states and the District, at a land-to-water ratio of roughly fourteen to one, the largest of any coastal watershed in the world. Whatever falls on that land, and whatever is on it, reaches the Bay with very little in between. The long-term mean inflow is 79,300 cubic feet a second; water year 2019 set the record at about 130,000, and the swing between a wet year and a dry one — 84 billion gallons a day in 2019 against 42 in 2023 — is larger than any change policy has produced.
Nobody publishes a single figure for how much stormwater the watershed's pavement generates, so we computed one and mark it as ours. The 2017/18 high-resolution land cover counts 1,927,940 acres of impervious surface, 4.75 percent of the land. One inch of rain on one acre is 27,154 gallons. At forty inches a year the region's roofs, roads and parking receive about 2.1 trillion gallons of rain — a ninth of the Bay's volume, 113 days of river inflow — and nearly all of it runs off; a city block generates more than five times the runoff of a forested block of the same size.
The scale of the water: what the Bay holds, what arrives, what is kept out
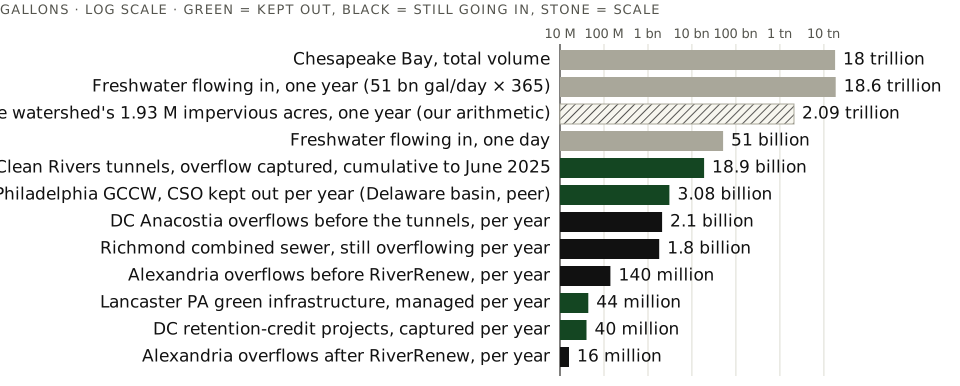
What it shows. Gallons on a logarithmic scale. Green bars are volumes documented as captured or kept out of receiving waters; black bars are volumes still discharged; stone bars set the scale. The hatched bar is our arithmetic (1,927,940 acres × 40 inches × 27,154 gallons per acre-inch), not a published figure. Philadelphia drains to the Delaware and is shown as a peer only.
Sources. CBP Bay Facts; Chesapeake Bay Commission fact sheet; CBP press release 16 Aug 2023; USGS Water Science School; DC Water Clean Rivers design targets and Greater Greater Washington, 13 Aug 2025 (18.9 billion gallons through June 2025 — a DC Water figure reported by GGWash, not on dcwater.com); EPA WIFIA (Alexandria); James River Association; Philadelphia Water Department; City of Lancaster; The Nature Conservancy, July 2024. Data: ex01-water.csv.
Two things stand out. The volumes engineering has kept out of local rivers are real but small against the system: the District's tunnels, at roughly $2.7 billion the largest stormwater project in the region, have captured 18.9 billion gallons of combined sewage over their operating life — about nine hours of river inflow. And the volumes still going in are concentrated in a handful of old combined-sewer cities: Richmond alone discharges around 1.8 billion gallons of mixed sewage and stormwater a year into the James, on a legislated schedule to 2035 and a $1.3 billion bill.
How much of the watershed's pavement is treated at all is not known as one number. Maryland's ten Phase I jurisdictions, with 173,838 impervious acres between them, had restored 46,782 acres across two permit terms by mid-2024 — 27 percent of their baseline. Prince George's County's public-private partnership has retrofitted about 5,000 acres since 2015. The District's retention-credit market captures about 40 million gallons a year. Those are the largest programs in the watershed, and together they treat a low single-digit share of its impervious surface.
IIIWhat is contaminated
The Bay's problem is not, in the main, toxic. It is arithmetic: too much nitrogen and phosphorus feed algae, the algae die and decompose, and decomposition strips oxygen from deep water each summer. In 2025 the watershed delivered an estimated 252.7 million pounds of nitrogen, 13.2 million pounds of phosphorus and 17.6 billion pounds of sediment to tidal waters. Agriculture is the largest source; developed land contributed about 16 percent of nitrogen, 15 percent of phosphorus and 10 percent of sediment in 2024; air deposition accounts for roughly a third of nitrogen once traced to the land it falls on.
The outcome measure the whole program is built around is the share of tidal water meeting its dissolved-oxygen, clarity and chlorophyll standards. It was about 26.5 percent in 1985–87 and 29.4 percent in 2021–23. In between it climbed to a record 42.2 percent in 2015–17 and fell back after the record rains of 2018–19. The program's own 2023 evaluation put the underlying rate of improvement at a quarter of a percentage point a year.
Share of Bay tidal waters meeting water-quality standards, 1985–2023
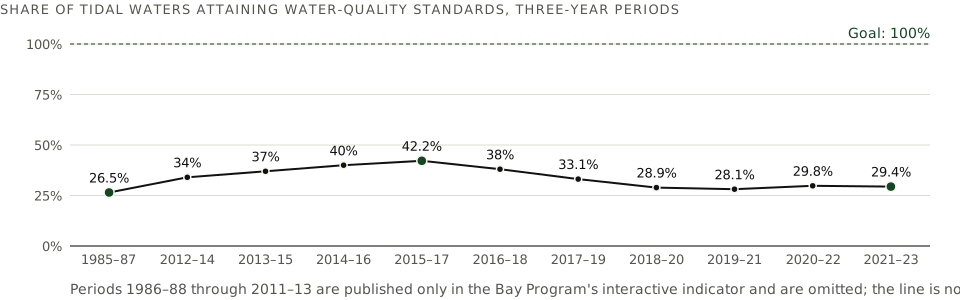
What it shows. The Bay Program's headline indicator over rolling three-year windows. Values for 1986–88 through 2011–13 are published only inside the interactive indicator and are not shown, so the horizontal spacing is not time.
Sources. STAC, CESR (2023) for 1985–87 (26.5%) ; CBP press releases 21 Sept 2016 (34%, 37%), Zhang et al. 2018 (40%), 26 Mar 2019 (42.2%), 13 May 2020 (38%), 14 Sept 2022 (33.1%), 26 Sept 2023 (28.1%), 31 Oct 2024 (29.8%), 3 Sept 2025 (29.4%); ChesapeakeProgress (28.9% revised). Data: ex02-attainment.csv.
The dead zone has been kinder lately for reasons that have little to do with policy: dry springs. The 2023 hypoxic volume was the smallest on record; 2025 was near the median and ended early when Hurricane Erin mixed the water column; the 2026 forecast, issued in May, called for a volume 31 percent below average because January–April nitrogen loads were 39 percent below normal and river flow 32 percent below normal. A dry year is not a clean year, and it should not be scored as one.
The dead zone, 2019–2025
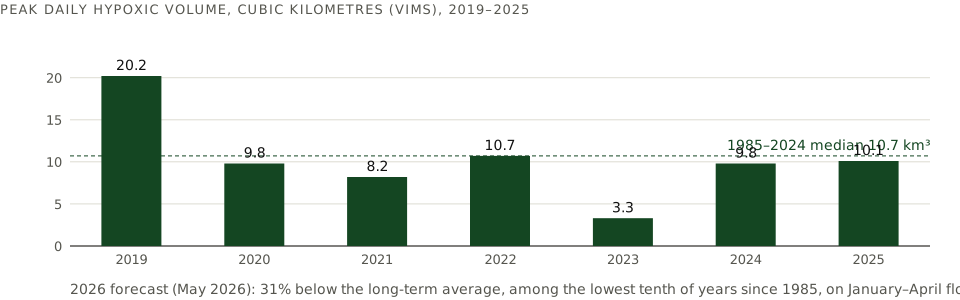
What it shows. Peak daily volume of hypoxic water (dissolved oxygen below 2 mg/L) each summer from the VIMS/Anchor QEA forecast-and-hindcast system, 2025 report vintage. VIMS re-ran its model between the 2024 and 2025 reports and the two vintages differ for the same year; one vintage is used throughout. Maryland DNR's mainstem summer-average series is on a different basis (cubic miles, May–October): 0.52 in 2023 (record low), 1.28 in 2025 (11th largest of 41 years).
Sources. VIMS Dead Zone Report Cards 2024 and 2025; MD DNR hypoxia reports Nov 2023 and Dec 2025; CBP press release 19 May 2026 (forecast). Data: ex03-hypoxia.csv.
Underwater grasses, 1984–2024
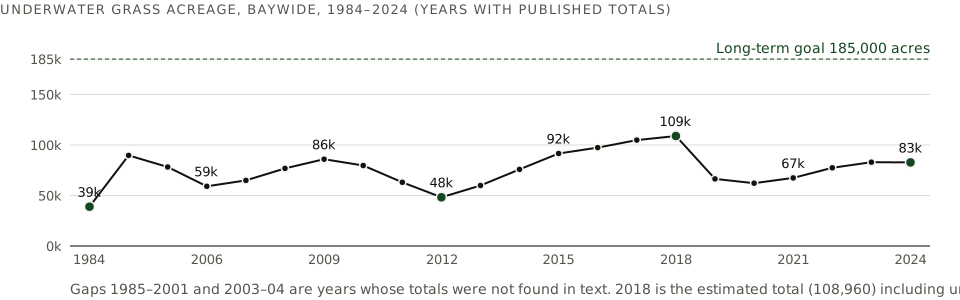
What it shows. Baywide acreage of submerged aquatic vegetation from the annual VIMS aerial survey — the Bay's best-behaved response indicator, because grasses need clear water. The 2018 peak of 108,960 acres was 59 percent of the 185,000-acre goal; the record rains of 2018–19 cut it by 40 percent in a year. 2024 stands at 82,778 acres, 45 percent of the goal and 64 percent of the 130,000-acre 2025 interim target. The 2025 survey had not been released at the time of writing.
Sources. VIMS SAV survey annual reports 2010–2025; CBP press releases 2007, 2009, 2016, 2020, 2022, 5 Aug 2025; ChesapeakeProgress. Data: ex04-sav.csv.
The Bay's report card, 2006–2024
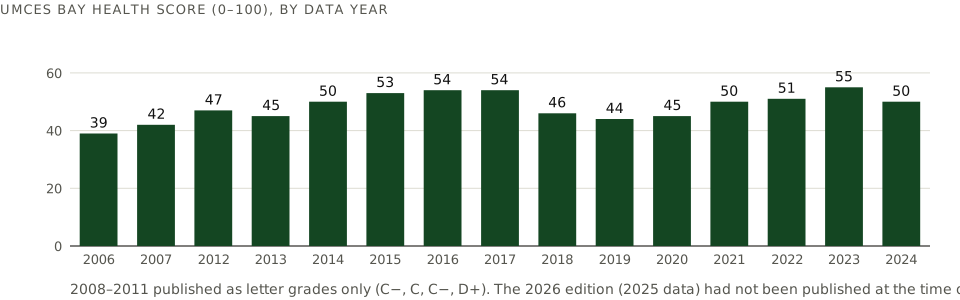
What it shows. The University of Maryland Center for Environmental Science's overall Bay health score, a composite of seven water-quality and biotic indicators, by data year. The 2023 score of 55 (C+) was the best in 21 years; 2024 fell back to 50 (C). Regionally in the 2025 edition the Elizabeth, James, Patapsco and Back, Upper Western Shore, Upper Bay and Lower Bay improved; the Upper Eastern Shore declined; the Choptank was the lowest-graded tributary the year before.
Sources. UMCES Chesapeake Bay Report Card editions 2007–2025 and the ecoreportcard.org archive. Data: ex05-reportcard.csv.
Blue crabs, 1990–2026
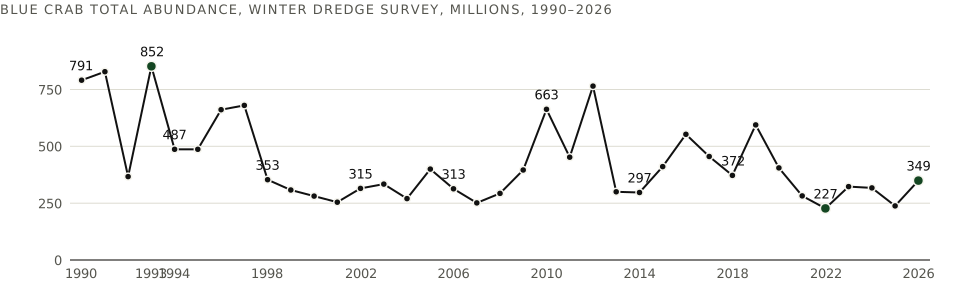
What it shows. Total blue crab abundance from the Winter Dredge Survey, millions. The 2022 count of 227 million was the lowest in the survey's history; 2026 rebounded to 349 million on a 121 percent jump in juveniles, with adult females (81 million) above the threshold but below the 196-million target. The 2024 baywide harvest was 42.5 million pounds; Virginia's share was worth $34.5 million.
Sources. MD DNR Winter Dredge Survey page; MD DNR press release 18 May 2026; CBP Blue Crab Advisory Report 30 June 2026; VMRC 2025 report. Data: ex06-bluecrab.csv.
Contamination in the narrower sense is nonetheless pervasive. In 2024, 80 percent of the Bay's tidal segments were partially or fully impaired by toxic contaminants — PCBs above all, with mercury and, increasingly, PFAS — down only from 84 percent in 2018. Maryland's 2024 Integrated Report lists 607 waterbody-pollutant combinations on its impaired-waters list, with 196 new temperature listings and 36 for PFOS; the report states plainly that all segments of the Bay are covered by nutrient TMDLs and that almost all remain impaired for nutrients. PCBs drive two-thirds of Virginia's 94 fish-consumption advisories. These are legacy loads that no buffer strip removes.
IVThe ledger, year by year
The Total Maximum Daily Load that EPA issued on 29 December 2010 is a pollution budget with a due date. Its original allocations — 185.9 million pounds of nitrogen, 12.5 million of phosphorus, 6.45 billion of sediment — were written on the Phase 5.3 model; after the watershed model was rebuilt, the operative 2025 planning targets became 219.5 million, 12.8 million and 18.6 billion pounds. The two sets are not comparable, and much public confusion comes from mixing them. Even within the current model the 2009 baseline is restated every year as inputs are revised (297.9 to 297.8 to 297.1 million pounds), which is why the annual series below should be read for direction, not for decimals.
Modelled nitrogen to the Bay by progress year, 2009–2025
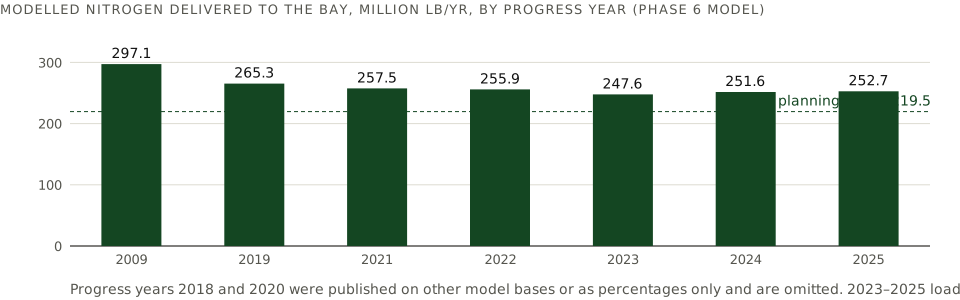
What it shows. Annual loads delivered to tidal waters from the Chesapeake Assessment Scenario Tool, which credits reported practices against land use with weather normalised. These are model estimates, not river gauges. Note that the load rose from 247.6 million pounds (2023) to 252.7 (2025): the practices did not fail — the inputs (fertiliser sales, animal numbers, verification of old practices) were revised upward. Phosphorus fell from 16.8 to 13.2 million pounds; sediment from 18.8 to 17.6 billion.
Sources. CBP press releases 10 Aug 2020 (2019), 22 June 2022 (2021), 26 Sept 2023 (2022), 2 May 2024 (2023), 3 June 2025 (2024), 6 Aug 2026 (2025). Data: ex07-cast-N.csv.
What the rivers actually carried: monitored loads and flow, by water year
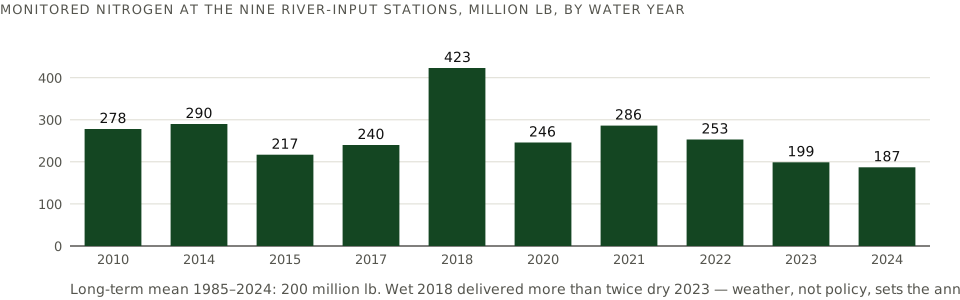
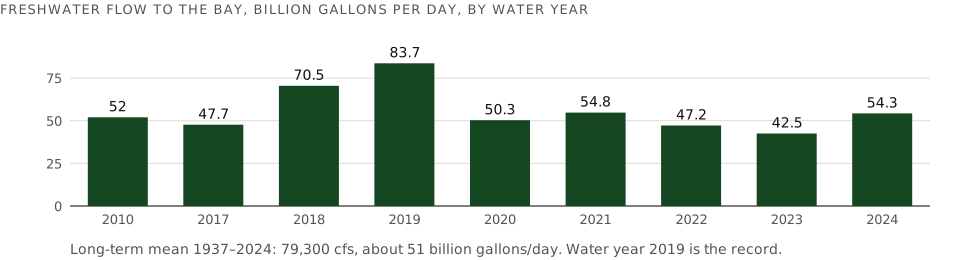
What it shows. Nitrogen measured at the nine USGS River Input Monitoring stations, which capture 78 percent of the watershed's inputs, and estimated total freshwater flow, by water year. The model above says loads fell 15 percent; the gauges say the year-to-year swing from weather is ±50 percent. Long-term monitored means, 1985–2024: 200 million pounds nitrogen, 11.8 million phosphorus, 3.9 million tons sediment. Years missing are years whose values were not published in text.
Sources. USGS, Measuring Nutrient and Sediment Loads (2010); CBP press releases 21 Sept 2016, 26 Mar 2019, 13 May 2020, 14 Sept 2022, 26 Sept 2023, 31 Oct 2024, 3 Sept 2025; USGS RIM Load and Trend Summary 2024. Data: ex08-usgs.csv.
Who did the cutting matters more than the totals. The Bay Program's own attribution: since 2009, wastewater upgrades produced 64 percent of nitrogen reductions and 61 percent of phosphorus reductions. The program's Scientific and Technical Advisory Committee put it more sharply for 2009–2021: wastewater 65 percent of nitrogen and 76 percent of phosphorus; cleaner air a further 25 percent of nitrogen; agriculture and urban land, which hold three-quarters of the remaining controllable load, together only 8 percent of nitrogen and 12 percent of phosphorus — about 3 million pounds of nitrogen a year from a decade of nonpoint work. Two sectors went the other way.
Who cut nitrogen, and who added it, 2009–2023
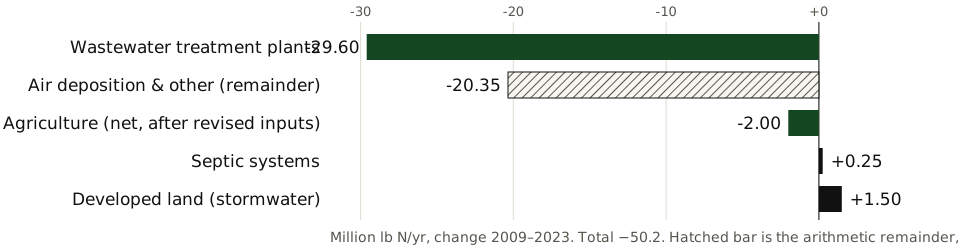
What it shows. Net change in modelled nitrogen load by sector, million pounds a year. Solid green bars are figures reported from the Bay Program's scenario tool; black bars are increases. The hatched bar is the difference between the reported total change (−50.2 million) and the named sectors, standing mostly for atmospheric deposition and natural land; it is our remainder.
Sources. Bay Journal, May/June 2024 (Blankenship), citing CBP CAST data; ChesapeakeProgress WIP page; STAC 23-003 (2023) p. 6. Data: ex09-sector.csv.
Progress toward the 2025 targets by jurisdiction, 2023 progress run
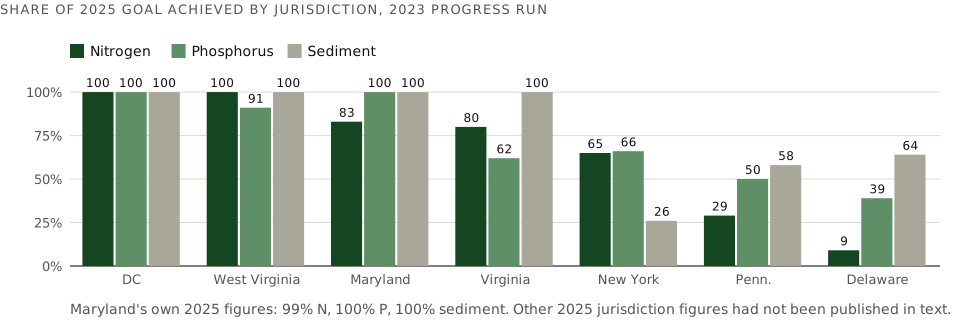
What it shows. Percentage of each jurisdiction's required 2009–2025 reduction achieved as of the last year for which the Bay Program published a full table. Pennsylvania holds the largest nitrogen allocation and sends half the Bay's fresh water down the Susquehanna; Delaware's Sussex County poultry basin is the other laggard. New York's sediment figure reflects the Upper Susquehanna.
Sources. CBP press release 2 May 2024; MD DNR 11 Aug 2026 (Maryland 2025). Data: ex10-jurisdictions.csv.
The remaining gap

What it shows. Million pounds of nitrogen a year still to be removed. EPA's 2024 evaluations put Pennsylvania's 2023 load at 101.07 million pounds against a 71.68-million target and Maryland's at 46.91 against a climate-adjusted 44.69; the watershed's 2025 gap is 33.2 million. Maryland's Department of Legislative Services notes that Maryland and Pennsylvania together hold 87.9 percent of the remaining nitrogen reductions.
Sources. EPA, 2024 Pennsylvania and Maryland milestone evaluations (May 2024); CBP press release 6 Aug 2026; MD DLS FY2026 overview. Data: ex39-gap.csv.
VMaryland, county by county
Maryland is the one jurisdiction in the watershed that publishes enough to build a county ledger, and it is the one that matters most to a Mid-Atlantic contractor. The State reports its nitrogen at basin scale: five basins, 45.8 million pounds of target, 46.6 million of load in 2024. Three basins are already under target. The whole of the shortfall is the Eastern Shore — nine counties, 17.8 million pounds against 15.6 — with small deficits in the Patuxent and the Susquehanna fringe.
Maryland's nitrogen by basin: target versus load
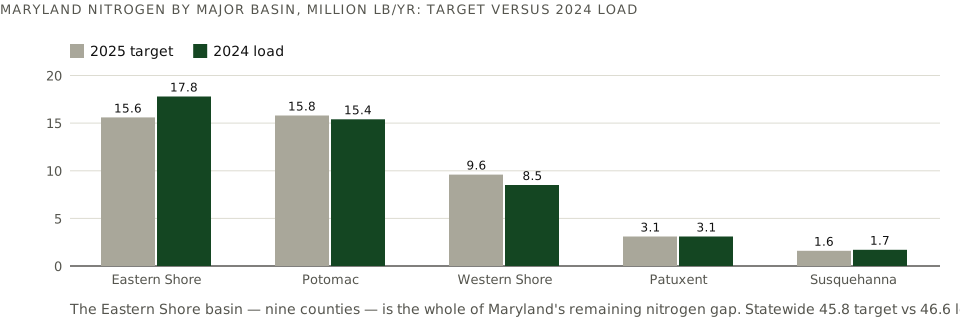
What it shows. Phase III WIP 2025 targets by major basin against 2024 loads. Eastern Shore: Cecil, Kent, Queen Anne's, Caroline, Talbot, Dorchester, Wicomico, Somerset, Worcester. Potomac: Garrett to St. Mary's along the river, including Montgomery, Prince George's and Charles. Western Shore: Harford, Baltimore County and City, Anne Arundel and parts of Carroll and Howard. The county-level targets in the WIP's Appendix C are published only as page images and could not be transcribed.
Sources. MDE, Phase III WIP Chapter IV, Table 8 (Aug 2019); MD DLS, Chesapeake Bay Fiscal 2027 Budget Overview. Data: ex11-md-basins.csv.
Maryland's nitrogen by sector, 2023
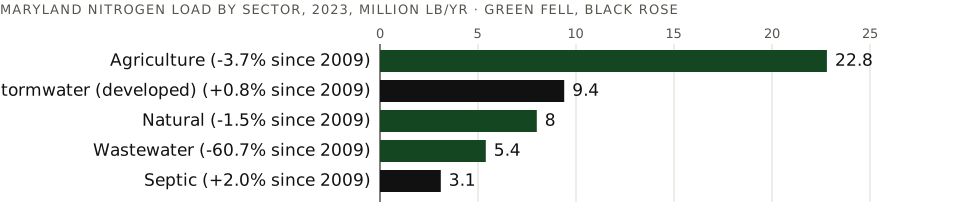
What it shows. Maryland's 48.7 million pounds of nitrogen in 2023 by source, with change since 2009. Wastewater fell 61 percent; agriculture, the largest sector, fell 3.7 percent; stormwater and septic rose. Note that the 2021 failures at Baltimore's Back River and Patapsco plants added about 2.5 million pounds in a single year — roughly the State's entire remaining gap at the time — before enforcement cut their discharges 70 and 85 percent.
Sources. MD DLS FY2026 Chesapeake Bay overview (CAST); CBF 2022; MDE settlement release 2 Nov 2023. Data: ex12-md-sectors.csv.
| Jurisdiction | Population 2024 | Land, sq mi | MS4 | Impervious baseline, ac | Restored / required, current permit | Stormwater fee | Land in farms, ac (2022) | Cover-crop ac 2023–24 | Septic BAT grants, $M | Notes |
|---|---|---|---|---|---|---|---|---|---|---|
| Allegany | 67,097 | 422 | — | — | — | none | 34,179 | 132 | 1.2 | Potomac headwaters |
| Anne Arundel | 602,350 | 415 | Phase I | 24,980 | 2,232 / 2,998 (74%) | $98.40/ERU | 36,003 | 3,182 | 40.9 | Largest septic program; 42% of credit from septic |
| Baltimore City | 568,271 | 81 | Phase I | 21,455 | 1,453 / 3,696 (39%) | $78/ERU (1,050 sq ft) | — | — | — | Back River & Patapsco plants; 48% of credit from sweeping |
| Baltimore Co. | 852,425 | 598 | Phase I | 30,180 | 2,060 / 2,696 (76%) | repealed 2017; general fund | 70,217 | 9,981 | 7.2 | Largest impervious baseline |
| Calvert | 94,913 | 213 | Phase II | — | 20% of untreated | none | 24,654 | 1,764 | 21.7 | Second-largest septic program |
| Caroline | 34,248 | 319 | — | — | — | none | 111,470 | 31,189 | 5.5 | 11.1 M broilers; poultry 73% of farm sales |
| Carroll | 177,108 | 448 | Phase I | 8,070 | 1,081 / 1,217 (89%) | none; property tax | 130,195 | 28,950 | 3.5 | Most MACS projects (59); sued over permit, lost 2019 |
| Cecil | 106,305 | 346 | Phase II | — | 20% of untreated | none | 81,040 | 21,096 | 11.5 | EIP's 10 miles of stream credits; Conowingo |
| Charles | 174,478 | 458 | Phase I | 7,887 | 815 / 1,083 (75%) | fee, $7.6M FY24 | 47,747 | 5,253 | 6.4 | Fastest-growing county after Frederick |
| Dorchester | 33,138 | 541 | — | — | — | none | 129,197 | 32,052 | 9.8 | 8.3 M broilers; Blackwater marsh loss |
| Frederick | 299,317 | 661 | Phase I | 9,903 | 295 / 1,027 (29%) | $0.01 per parcel | 188,832 | 35,807 | 5.2 | Most farmland; +42% population by 2050; data centers |
| Garrett | 28,393 | 649 | — | — | — | none | 95,546 | 1,126 | 1.6 | Partly drains to the Ohio |
| Harford | 265,514 | 437 | Phase I | 10,928 | 0 / 1,093 (0%)* | none; recordation tax | 65,954 | 14,438 | 6.5 | *County reports 1,019 ac on its own basis |
| Howard | 339,668 | 251 | Phase I | 11,019 | 1,307 / 1,345 (97%) | fee, $10.5M FY24 | 37,639 | 2,929 | 2.6 | Highest projected cost per acre ($260,050) |
| Kent | 19,557 | 277 | — | — | — | none | 141,662 | 58,435 | 8.1 | Most cover-crop acres in the State |
| Montgomery | 1,082,273 | 493 | Phase I | 18,891 | 1,190 / 1,814 (66%) | $157.50/ERU | 69,759 | 12,180 | 3.2 | Oldest fee (WQPC); ~$69M/yr |
| Prince George's | 966,629 | 483 | Phase I | 30,525 | 427 / 2,137 (20%) | $20.90/ESU + $20.58 | 32,892 | 2,591 | 0.9 | Corvias P3; consent decree 2021; $101M spent FY24 |
| Queen Anne's | 53,688 | 372 | Phase II | — | 20% of untreated | none | 162,145 | 57,198 | 18.9 | Second in cover crops; Wye oyster sanctuary |
| St. Mary's | 116,469 | 359 | Phase II | — | met through 2025 | none | 64,380 | 7,300 | 17.4 | |
| Somerset | 25,241 | 320 | — | — | — | none | 63,019 | 12,101 | 4.9 | 10.8 M broilers; poultry 88% of sales; Princess Anne, last ENR plant |
| Talbot | 38,244 | 269 | — | — | — | none | 96,228 | 37,142 | 12.5 | Harris Creek oysters: ~100,000 lb N/yr |
| Washington | 157,228 | 458 | Phase II | — | 20% of untreated | none | 121,251 | 12,934 | 4.9 | Antietam whole-watershed pilot |
| Wicomico | 106,329 | 374 | Phase II | — | 20% of untreated | none | 69,906 | 24,121 | 9.7 | 9.6 M broilers; highest poultry sales ($298M) |
| Worcester | 54,337 | 468 | — | — | — | none | 104,121 | 34,739 | 4.7 | 8.6 M broilers; coastal bays |
| Maryland | 6,263,220 | 9,711 | 10 + 6 | 173,838 | 10,860 / 19,106 (57%) | 6 true fees | 1,978,036 | 446,640 | 227.8 | 45.8 M lb N target; 46.6 M load (2024) |
Population and land area: Maryland Department of Legislative Services, July 2024. Impervious baselines and restoration: MDE Stormwater Financial Assurance Plan report, Oct 2025 (FY2024 data). Fees: county pages and FAP reports. Land in farms: 2022 Census of Agriculture via Maryland Department of Planning. Cover crops: MDA Conservation Grants FY2024. Septic grants: MDE Bay Restoration Fund Advisory Committee 2025 report (cumulative to 30 June 2024). Broilers: USDA 2022 county profiles. Phase II counties (Calvert, Cecil, Queen Anne's, St. Mary's, Washington, Wicomico) hold a general permit requiring 20 percent of untreated impervious area; their acreage is not reported centrally. Data: ex13-md-phase1.csv, ex16-covercrops.csv, ex17-poultry.csv, ex18-septic.csv.
The Phase I ten: impervious baseline
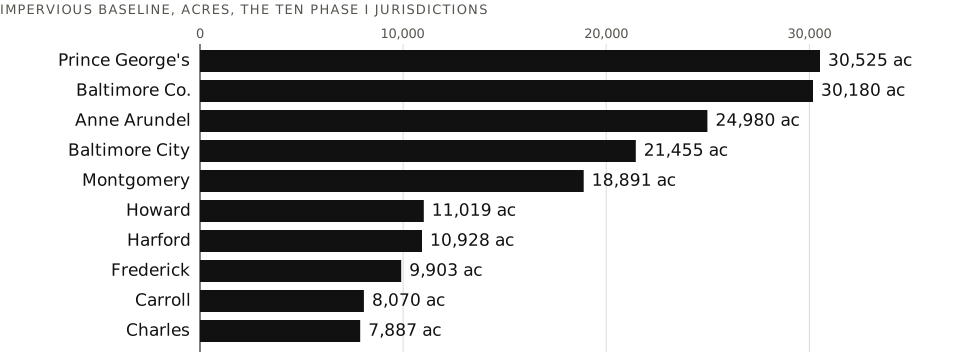
What it shows. Impervious acres in each Phase I jurisdiction's municipal separate storm sewer baseline, the denominator of every restoration requirement. Prince George's and Baltimore County carry 60,000 acres between them. The State Highway Administration's separate permit covers more than 40,000 impervious acres of road.
Sources. MDE FAP report Oct 2025, Table 1; MDOT SHA MS4 fact sheet 2024. Data: ex13-md-phase1.csv.
The Phase I ten: how far along the current permits are
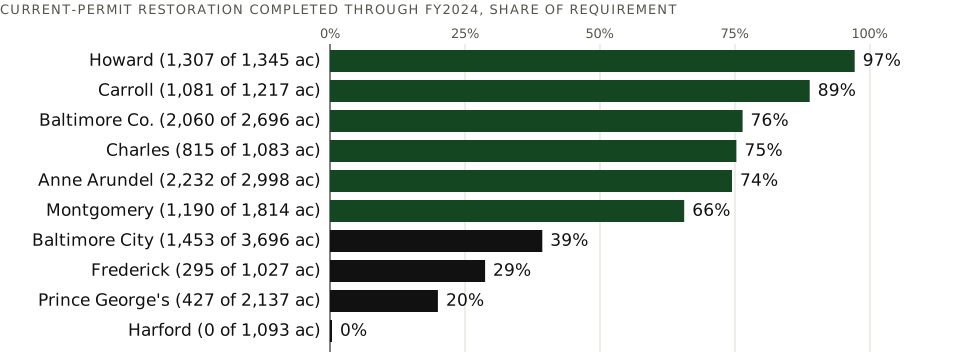
What it shows. Acres restored under the 2021–22 permits through FY2024 as a share of each permit's requirement. The current-cycle requirement is about 11 percent of baseline, down from 20 percent in the 2014 cycle, under which the ten restored 35,922 acres against 34,768 required. Howard, Carroll, Baltimore County and Anne Arundel lead; Frederick, Prince George's (under a 2021 consent decree with a $475,000 penalty), Baltimore City and Harford lag. All ten project completing the term. Statewide projected cost of the two-year plan: $414 million for 9,037 acres, $45,816 an acre.
Sources. MDE FAP reports Sept 2024 (FY23) and Oct 2025 (FY24), Tables 2, 3 and 8. Data: ex13-md-phase1.csv.
The Phase I ten: what they spent in FY2024, and who pays a fee
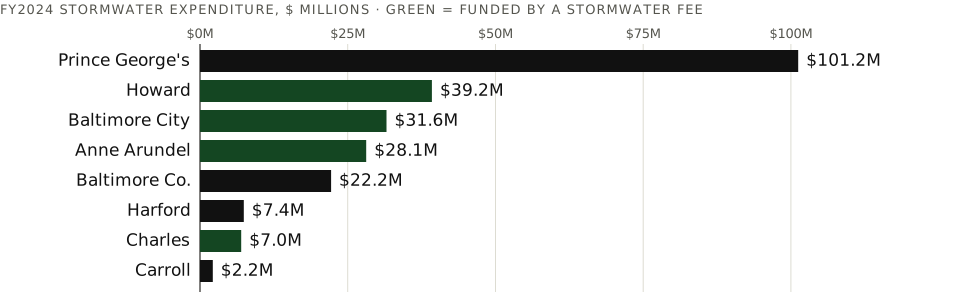
What it shows. FY2024 stormwater expenditure by jurisdiction from the Financial Assurance Plan reports; Montgomery is exempt from reporting and Frederick reported no breakdown. Green bars are jurisdictions funded chiefly by a dedicated stormwater fee; black bars are funded from general funds, bonds or other taxes. Prince George's $101 million is an enterprise fund fed by its Clean Water Act fee, bonds and general funds. Statewide: $239 million spent, $284 million of revenue, of which only $84.6 million was remediation-fee income. The 2012 fee mandate covered exactly these ten; six kept a real fee after the 2015 repeal.
Sources. MDE FAP report Oct 2025, Tables 9–10; MDE FAP report 2020 for the repeal history; county fee pages. Data: ex13-md-phase1.csv.
Where four jurisdictions earn their acres
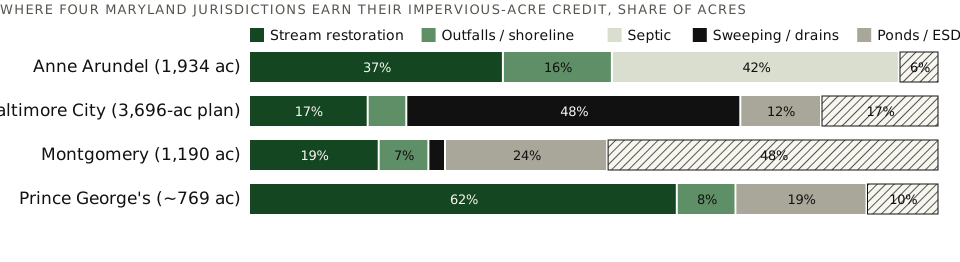
What it shows. The practice mix behind impervious-acre credit in four county Financial Assurance Plans, as a share of acres credited or planned. Stream restoration is the largest structural practice everywhere — 37 percent in Anne Arundel, about 62 percent in Prince George's, a majority of Howard's plan — but it is not the majority of credit in every county: Anne Arundel earns 42 percent from septic upgrades and connections, Baltimore City 48 percent from vacuum street sweeping and storm-drain cleaning. "Other" includes program credits, illicit-discharge elimination and, for Montgomery, acres the plan does not allocate by practice. Figures are parsed from PDF tables and are approximate.
Sources. Anne Arundel, Baltimore City, Montgomery and Prince George's FY2024 Financial Assurance Plans (MDE FAP-WPRP 2024). Data: ex20-practice-mix.csv.
Cover crops by county, 2023–24 season
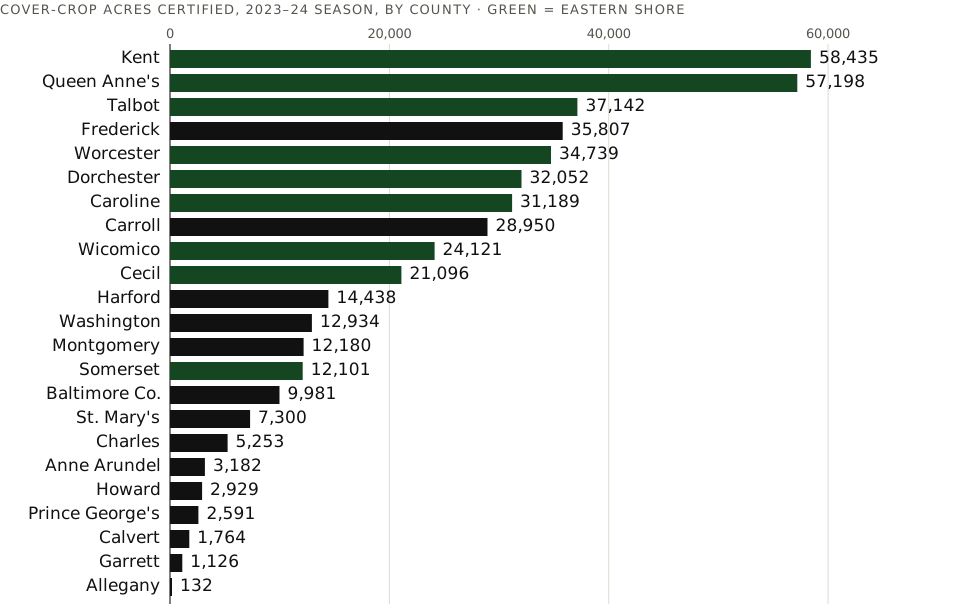
What it shows. Certified cover-crop acres in Maryland's cost-share program by county, from 1,319 contracts and $29.6 million in payments. Nine Eastern Shore counties (green) planted 326,000 of the State's 446,640 acres. The FY2025 season reached a record 491,000 acres planted and 3.4 million pounds of nitrogen credited; FY2026 enrolment is 625,000 acres on a $22.5 million budget.
Sources. MDA Conservation Grants Program FY2024 annual report; MDE BRF 21st report. Data: ex16-covercrops.csv.
The poultry counties
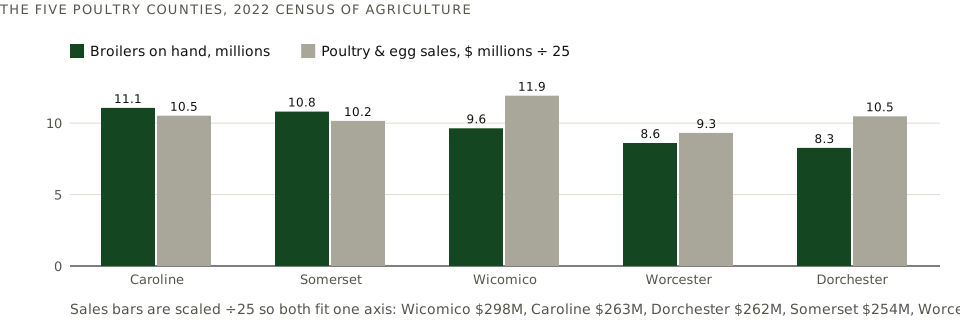
What it shows. Broilers on hand and poultry sales in the five Lower and Mid Shore counties that, with Delaware's Sussex, form the Delmarva broiler belt: 628 million chickens a year across the peninsula, 4.7 billion pounds of meat, $4.6 billion in sales, 1,225 growers, 4,814 houses. Poultry is 73–88 percent of these counties' farm sales, and their manure is the Eastern Shore's nitrogen and phosphorus problem. In FY2024 Worcester, Somerset and Dorchester completed one, one and three cost-shared capital projects respectively.
Sources. USDA 2022 Census of Agriculture county profiles (cp24011, 24039, 24045, 24047, 24019); Delmarva Chicken Association 2025 facts; MDA FY2024. Data: ex17-poultry.csv.
Septic upgrades by county
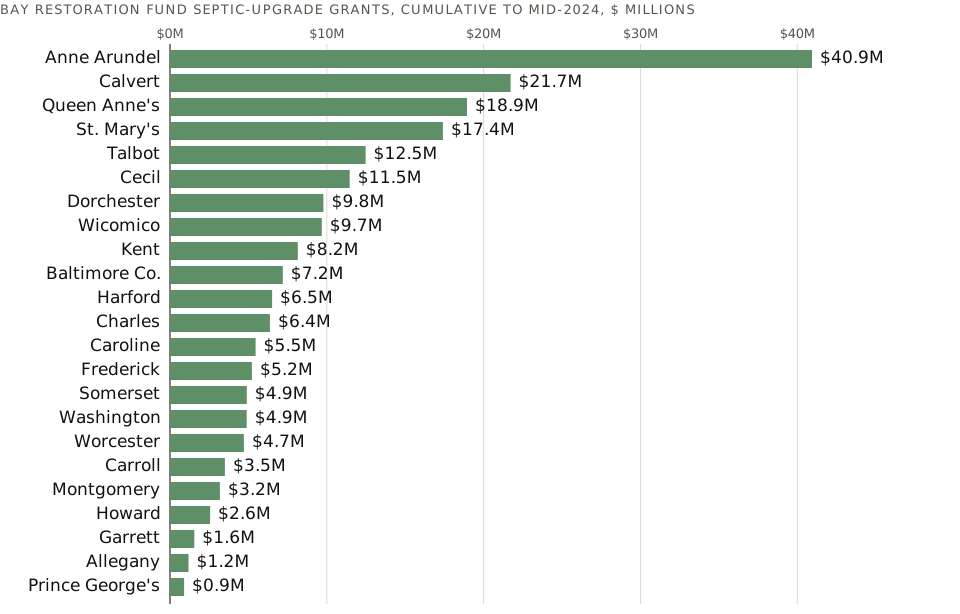
What it shows. Cumulative Bay Restoration Fund grants for denitrifying septic systems and sewer connections by county through mid-2024 — the best available proxy for where the 17,184 upgrades sit, since the fund reports dollars, not units, by county. Anne Arundel, Calvert, Queen Anne's and St. Mary's — tidewater counties with large unsewered populations — lead. Statewide $228 million; 10,550 of the upgrades are in the Critical Area within 1,000 feet of tidal water.
Sources. MDE BRF Advisory Committee reports Jan 2025 and Jan 2026. Data: ex18-septic.csv.
Read together, the county tables say something the statewide numbers hide. The counties with the money and the permits — Montgomery, Prince George's, Baltimore, Anne Arundel, Howard — are the counties whose basins are already under target. The counties with the load — Kent, Queen Anne's, Caroline, Dorchester, Wicomico, Somerset, Worcester — have no MS4 obligation, no stormwater fee, and a farm economy in which one integrator's manure decides the phosphorus balance. Maryland's $239 million a year of stormwater spending and its $30 million cover-crop program are aimed at different halves of the State, and only one half is short.
VIWhat is actually helping
Three kinds of evidence answer this question, and they do not agree. The model credits practices at their designed efficiency. The state programs report what they paid for. The rivers report what arrived. Where all three agree — point sources — the answer is unambiguous. Where they diverge — farm practices and stream restoration — the honest answer is "less than credited, for reasons we partly understand."
Pounds credited to Maryland programs, per year
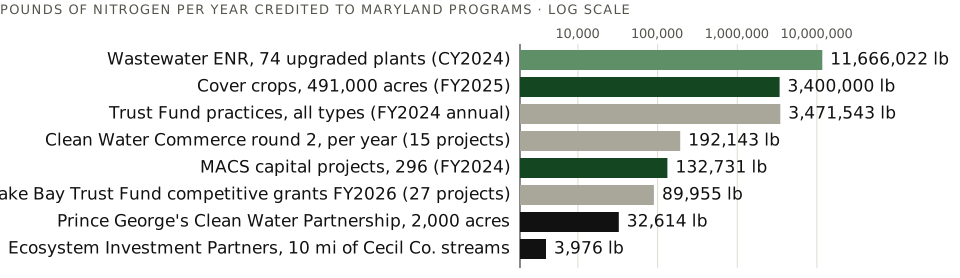
What it shows. Annual nitrogen reductions credited to named Maryland programs, on a log scale. The 74 upgraded wastewater plants removed 11.67 million pounds in 2024 against their pre-upgrade discharge — an order of magnitude above the next line. Cover crops are the largest agricultural credit at 3.4 million pounds modelled. The Trust Fund's FY2024 figure covers all practices it funded that year, including cover crops, and overlaps the cover-crop line. Clean Water Commerce, the State's pay-for-performance purchase, and the Prince George's partnership are shown at their annual rates.
Sources. MDE BRF 21st report (Jan 2026); MDA FY2024; DNR Trust Fund FY24–26 report; MDE Clean Water Commerce selections (Feb 2025); DNR Trust Fund release 8 July 2025; Water Online (PG CWP); Ecosystem Investment Partners. Data: ex21-md-credited.csv.
Point sources: unambiguous
Enhanced nutrient removal at treatment plants is the one practice for which the model, the invoice and the river all agree. Maryland's 66 of 67 major plants run at an average effluent of under 2.85 mg/L of nitrogen against a 3.25 goal; Blue Plains, at 370 million gallons a day the largest advanced plant in the world, has kept more than 144 million pounds of nitrogen out of the Potomac since it began nitrogen removal, and the Potomac's grass beds came back behind it. Mattawoman Creek, where a 1991–95 plant upgrade cut nitrogen 60 percent, saw chlorophyll fall from 50–100 micrograms a litre and grasses return within one to four years. When Baltimore's two plants failed in 2021 the State's wastewater nitrogen jumped from 5.46 to 7.98 million pounds in a year; when enforcement restored them, it fell back. The signal is immediate because the pipe is one pipe.
Air: the reduction nobody paid for
USGS's accounting of inputs from 1985 to 2019 finds atmospheric nitrogen deposition fell by about 7 kilograms per hectare across the watershed — roughly 163 million kilograms in total — as the Clean Air Act cut power-plant and vehicle emissions. STAC credits cleaner air with a quarter of all nitrogen reductions. No Bay agency funded it.
Farm practices: large on paper
The model's biggest agricultural credit, Maryland's cover crops, is worth 3.4 million pounds of nitrogen a year at 491,000 acres. The field science supports the practice and undercuts the credit: early-planted rye cuts nitrate leaching 67 percent, late-planted wheat 27 percent, and in Maryland from 2008 to 2017, 68 percent of cover-crop fields were wheat and 35 percent were planted late. Late termination after 1 May adds 48 percent more uptake; most fields are terminated earlier. Satellite verification now covers 98 percent of Maryland's cover-crop fields, which is a real advance, but it verifies presence, not performance. At the watershed scale STAC found that a decade of nonpoint work produced about 3 million pounds a year of nitrogen reduction, and USGS finds that agricultural nitrogen and phosphorus surpluses have been rising since 2009 in the eastern and northern watershed, most consistently in Pennsylvania. Groundwater lag compounds the problem: median groundwater age on the Delmarva is 20 to 40 years, so a buffer planted in Kent County today will show in the Chester River around 2050.
Streamside forest buffers: the goal and the record
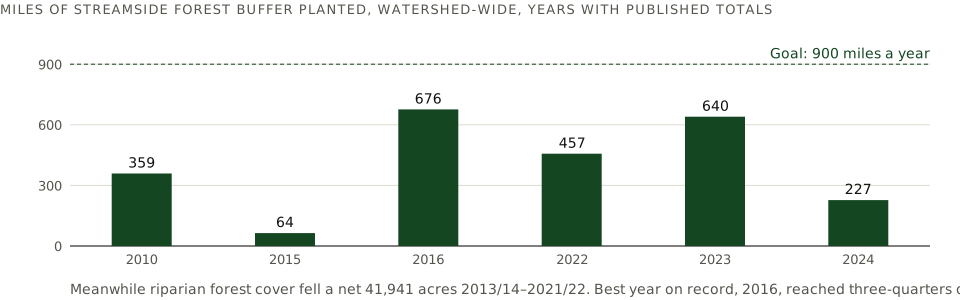
What it shows. Miles of riparian forest buffer planted across the watershed in years with published totals, against the Watershed Agreement's goal of 900 miles a year. The best year, 2016, reached 676 miles; 2024 fell to 227. Pennsylvania (268 miles) and Virginia (298) did most of the 2023 planting; Maryland planted 40. Net riparian forest cover meanwhile fell 41,941 acres between 2013/14 and 2021/22. The revised 2025 Agreement resets the goal to 7,500 acres a year by 2035.
Sources. CBP blog 2016; CBP press releases 12 June 2024 and Sept 2025; ChesapeakeProgress forest buffers chart. Data: ex22-buffers.csv.
Stream restoration: the contested credit
About 266 miles of stream have been "restored" in the watershed since 2010, with 84 more planned — more than 600 permits in Maryland and 300 in Virginia since 2014, and roughly $500 million by one 2020 estimate. It is the largest structural practice in every Maryland county's stormwater plan. STAC's 2024 review found moderate water-quality improvement at some monitored sites, one — Flatlick Branch — exceeding its credited reduction, but that "significant biological uplift is rare," that reach-scale projects do not address watershed stressors, and that removing mature trees to regrade a channel causes short-term harm. Maryland's own scientists doubt "that we can bring the ecology back." The practice earns its credit under a protocol; whether it earns it in the stream is, by the program's own account, unsettled.
Urban retrofits: working, when maintained
The Bay Program's tracking of 2,886 urban practices found inspection documented for 63 percent in Maryland and the District against 98 percent in Virginia; older Northern Virginia and King County studies found over half of practices failing within five years for want of maintenance. Every credit in this study assumes a working practice. A rain garden that has silted in removes nothing at any price.
Oysters: small, real, and rising
Harris Creek's 350 restored acres hold more than two billion oysters that filter the creek every ten days in summer and have removed about a million pounds of nitrogen over a decade — roughly 100,000 pounds a year, or a third of the entire Chesapeake Bay Trust Fund's projected annual credit. Eleven tributaries and 2,400 acres are now restored; Maryland's oyster population has tripled since 2005; Virginia's shellfish farm-gate value rose from $53 million to $81 million between 2018 and 2024.
Buying pounds: the price signal
Where the region has let a verified pound of nitrogen find its price, the price has been low. Maryland's Clean Water Commerce program, funded at $20 million a year from the flush tax, bought 192,143 pounds a year in its second round at an average of about $21 a pound against a $150 ceiling — 19 percent cheaper than the first round — with the best farm projects at $14 to $16 and shoreline or wetland projects at $179 to $200. Virginia's offset fund charges $5.08. PENNVEST's 2024 procurement drew bids from 46 cents to $460. Maryland's registry holds 1.36 million pounds of certified credits waiting for buyers.
What a verified pound of nitrogen sells for
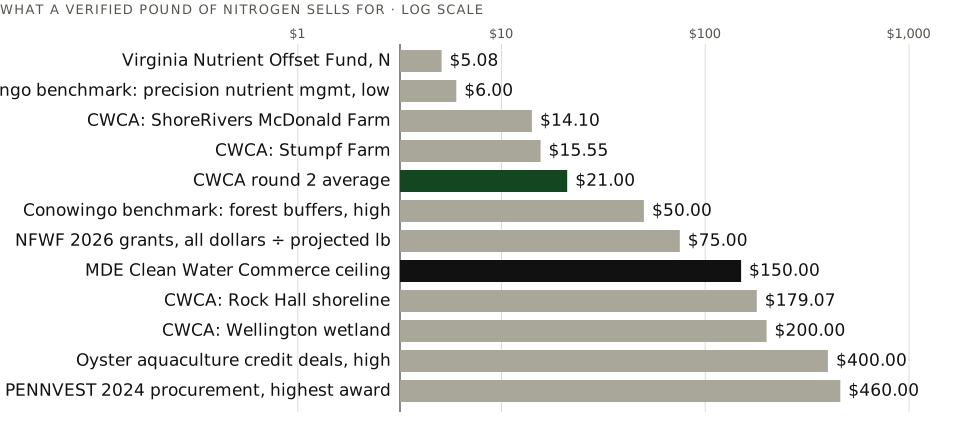
What it shows. Prices per pound of nitrogen from actual purchases, offers and benchmarks in the three trading jurisdictions, log scale. The Clean Water Commerce average (green) sits at $21; the regulatory ceiling (black) at $150; the NFWF figure divides the 2026 grant round's total dollars by its projected annual pounds and so overstates the price of nitrogen alone, since those grants buy habitat and other outcomes too.
Sources. EPA, Virginia water-quality trading case study (Oct 2024); MD DLS FY2026 (Conowingo benchmarks); MDE CWCA FY24–25 project selections (Feb 2025); MDE BRF 21st report; NFWF 11 Feb 2026; PENNVEST Feb 2024; Bay Journal 2020 (oyster credits). Data: ex27-trading.csv.
Effectiveness, fourteen ways
"What works" is not one question. It is at least fourteen: what a practice removes as a share of what reaches it; what it removes per unit built; what a dollar buys; what an acre costs; who has actually delivered the reductions; how long each pathway takes to show in the water; what the practice does in the field rather than in the model; whether it is inspected and whether it survives; what the pipe discharges before and after; what the largest programs have banked; what the rivers say; how much of the plan is in the ground; why counties choose the practices they choose; and what each county pays. The fourteen exhibits below take them in that order, each on its own scale, each with its source.
1 · Removal efficiency: share of the incoming load each practice takes out
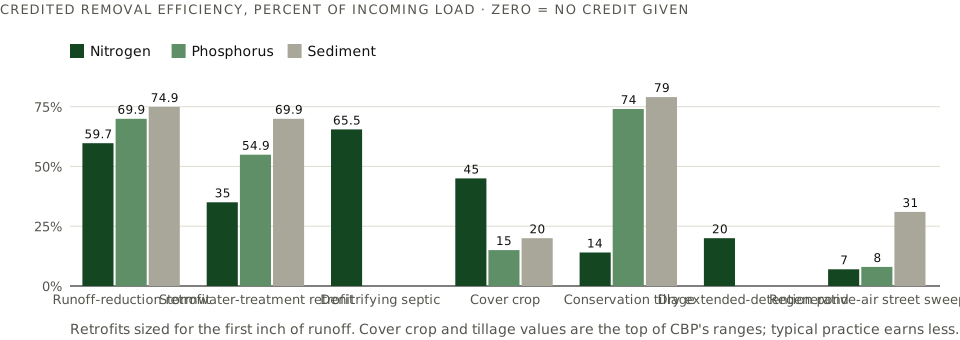
What it shows. The percentage of nitrogen, phosphorus and sediment a practice is credited with removing from the load that reaches it. Runoff-reduction retrofits sized for the first inch earn 59.7 percent of nitrogen; treatment retrofits 35 percent; a denitrifying septic unit 54–77 percent; an early-drilled rye cover crop up to 45 percent; regenerative-air sweeping 7 percent. A high efficiency on a small load is still a small number, which is why this exhibit must be read with the next.
Sources. MDE MS4 Accounting Guidance (Nov 2021); MDE BAT ranking (Feb 2026); CBP Quick Reference Guide for BMPs; CBP street-sweeping expert panel. Data: ex40-efficiency.csv.
2 · Yield: pounds of nitrogen a year per unit built
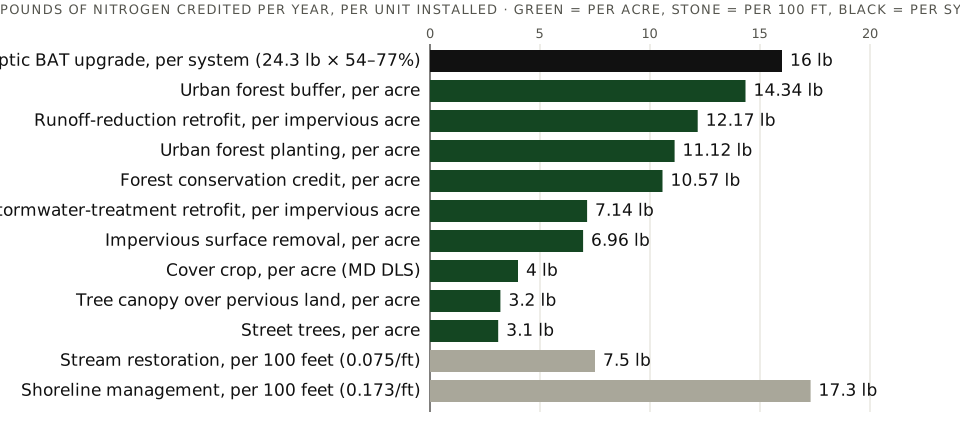
What it shows. Maryland's default credit per unit installed. One septic upgrade earns about 16 pounds a year; one acre of urban forest buffer 14; one impervious acre under a runoff-reduction retrofit 12; an acre of cover crop about 4; an acre of tree canopy 3. Stream restoration earns 0.075 pounds per linear foot — 7.5 per hundred feet, 396 per mile — which is why counties need thousands of feet of it to move the ledger.
Sources. MDE MS4 Accounting Guidance (Nov 2021) default loading and credit rates; MDE BAT ranking; MD DLS (2013) for cover crops. Data: ex41-lb-per-unit.csv.
3 · Purchasing power: what one million dollars buys
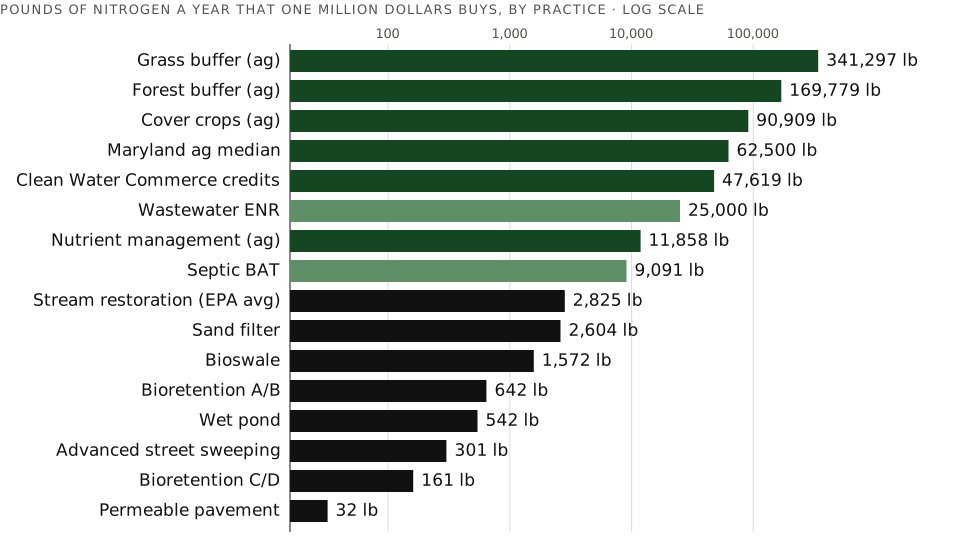
What it shows. The cost-per-pound exhibit turned the other way up: pounds of nitrogen a year that $1 million of annualised spending delivers. A million dollars in grass buffers buys 341,000 pounds a year; in treatment-plant upgrades 25,000; in septic units 9,100; in sand filters 2,600; in bioretention 640; in permeable pavement 32. Log scale.
Sources. As the cost-per-pound exhibit (UMCES 2021; EPA CBPO 2021; MD Bay Cabinet; MD DLS 2013; MDE). Data: ex42-lb-per-million.csv.
4 · The acre: what it costs to treat one impervious acre
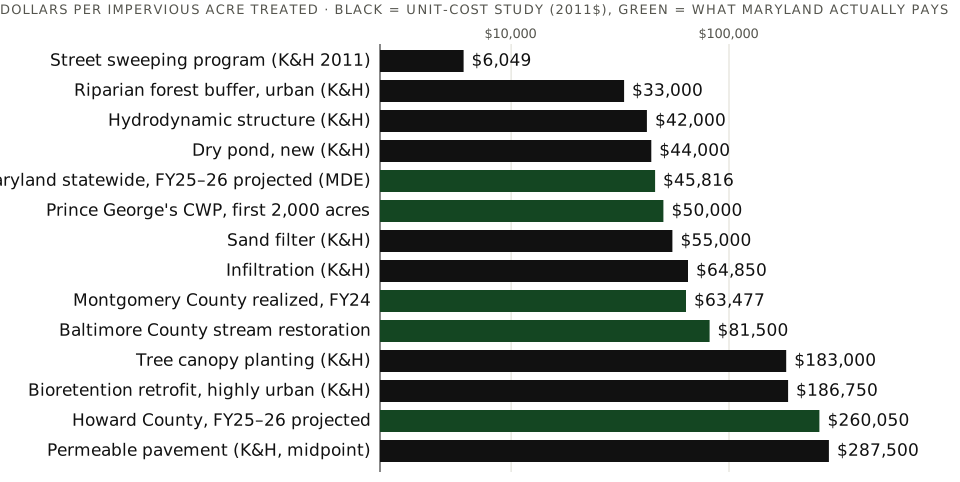
What it shows. Cost per impervious acre treated, the currency of Maryland's permits, from the 2011 unit-cost study (black, 2011 dollars) and from what jurisdictions actually report paying (green). Sweeping programs and hydrodynamic structures are cheapest per acre but earn little per acre; the State's projected average is $45,816; Howard's is $260,050 because its remaining acres are the hard ones.
Sources. King & Hagan, UMCES CBL 11-043 (2011); MDE FAP report Oct 2025; EPA G3 (Prince George's); Montgomery, Baltimore County and Howard FY24 FAPs. Data: ex43-cost-per-acre.csv.
5 · Delivery: who produced the reductions, 2009–2021
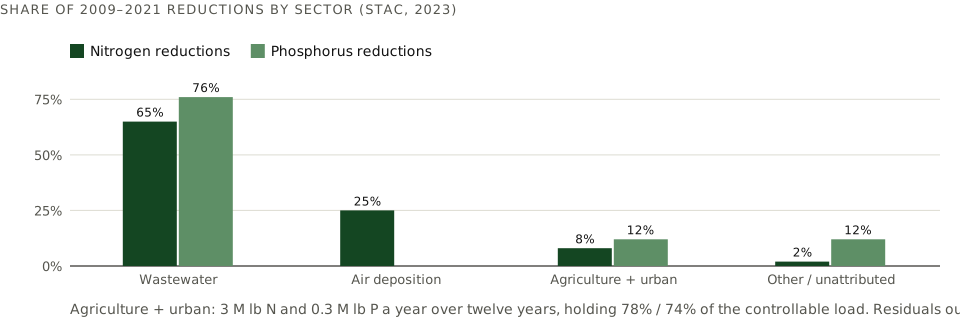
What it shows. The independent evaluation's attribution of twelve years of reductions. Wastewater, one permitted sector, delivered two-thirds of nitrogen and three-quarters of phosphorus; cleaner air a quarter of nitrogen; agriculture and urban land together, holding three-quarters of the controllable load, 8 and 12 percent.
Sources. STAC 23-003 (2023), p. 6. Data: ex44-stac-shares.csv.
6 · Patience: years between the practice and the signal
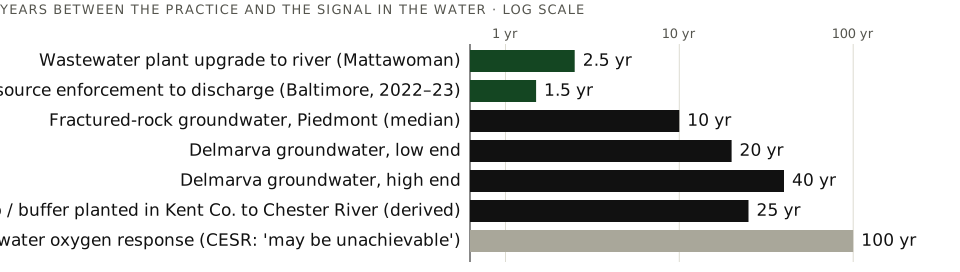
What it shows. How long each pathway takes to show in the water. A plant upgrade shows in its receiving creek in one to four years; enforcement at Baltimore's plants showed in eighteen months. Groundwater in the fractured rock of the Piedmont takes a median ten years; on the Delmarva twenty to forty. The Kent County bar is our midpoint of that range. The deep-channel oxygen response is the one STAC says may not be achievable at all; it is drawn at a century as a placeholder for "not in a planning horizon."
Sources. Boynton et al. 2014; MDE settlement release Nov 2023; Sanford & Pope 2013 (USGS); STAC CESR 2023. Data: ex45-lag.csv.
7 · The field versus the model: cover crops as actually managed
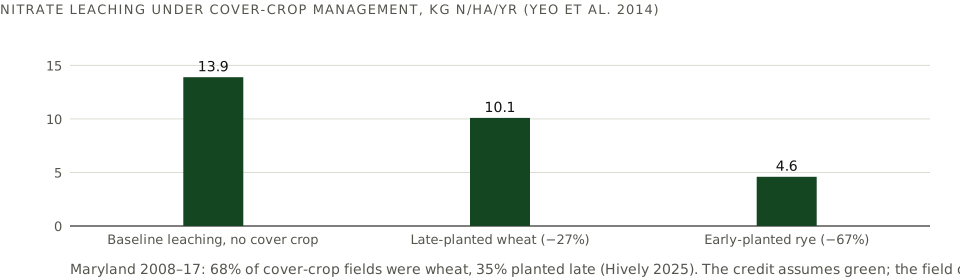

What it shows. Top: nitrate leaching under three managements from Yeo et al. — an early-planted rye cover crop cuts leaching 67 percent, a late-planted wheat one 27 percent. Bottom: what Maryland's fields actually did over a decade, per Hively et al. — two-thirds wheat, a third planted late — and the two things that would raise performance: later termination (+48 percent uptake) and the satellite verification that now covers 98 percent of enrolled fields. The Bay Program's credit sits between the green bar and the black one; the field, more often than not, delivers the black one.
Sources. Yeo et al., Hydrology and Earth System Sciences 18 (2014); Hively et al., J. Environmental Quality (2025). Data: ex46-covercrop-mgmt.csv.
8 · Survival: inspection rates and what field surveys found
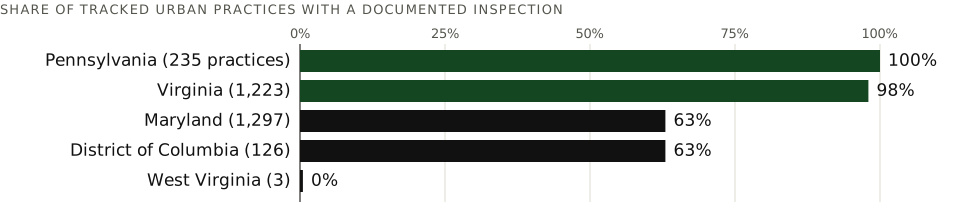

What it shows. Top: the share of tracked urban practices with a documented inspection by jurisdiction in the Bay Program's tracking of 2,886 practices — Pennsylvania and Virginia near complete, Maryland and the District at 63 percent. Bottom: what older field surveys found when they looked: over half of practices failing within five years for want of maintenance, half of wet ponds defective, three-quarters of bioswales in fair or poor condition, fewer than half of infiltration practices still working. No Bay-region survey of comparable scope has been published since; the numbers are old and should be read as a warning, not a rate.
Sources. CBP CBAT BMP inspection presentation; Northern Virginia PDC (2000), King County (1995), Livingston et al. (2000), as compiled by Stormwater Solutions. Data: ex47-inspection.csv, ex47b-failure.csv.
9 · The pipe: nitrogen in treated sewage, before and after
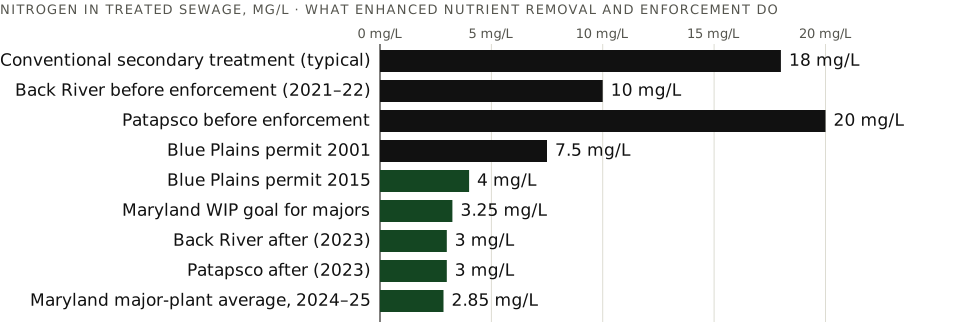
What it shows. Total nitrogen in effluent, milligrams per litre, for standards and plants. Conventional secondary treatment leaves around 18; Baltimore's two plants ran at 10 and 20 during their 2021–22 failures; enhanced nutrient removal takes a plant to 3, and Maryland's 66 upgraded majors now average 2.85 against a 3.25 goal. Blue Plains' permit tightened from 7.5 to 4.0. Nothing else in this study moves a number by a factor of six in eighteen months.
Sources. MDE settlement release 2 Nov 2023; DC Water; MDE BRFAC 2025 report. The conventional-treatment value is a textbook typical, not a plant measurement. Data: ex48-effluent.csv.
10 · The bank: what the largest programs have delivered
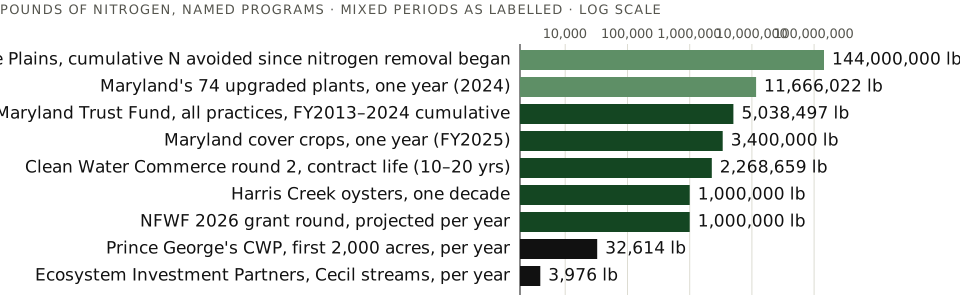
What it shows. Pounds of nitrogen attributed to named programs, on a log scale, with mixed periods labelled: Blue Plains' 144 million pounds is cumulative over roughly three decades; Maryland's plants' 11.7 million is one year; the Trust Fund's 5 million is twelve years of everything it funded; Harris Creek's million is a decade of oysters. Read the labels, not just the bars — but note that the two point-source lines still dominate on any basis.
Sources. DC Water; MDE BRF 21st report; DNR Trust Fund FY24–26 report; MDE Clean Water Commerce; Harris Creek study (VIMS/UMCES); NFWF Feb 2026; Water Online; EIP. Data: ex49-wins.csv.
11 · The rivers' verdict: monitoring-station trends
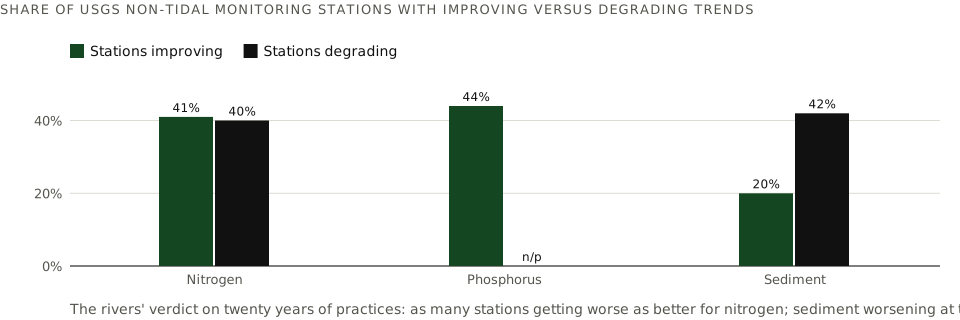
What it shows. The share of USGS non-tidal network stations with statistically improving versus degrading long-term trends, as summarised on the Bay Program's TMDL tracking page. Nitrogen is improving at as many stations as it is worsening; sediment is worsening at twice the rate it improves. The phosphorus degrading share is not published on the page.
Sources. CAST, TMDL Tracking (USGS NTN trends). Data: ex50-station-trends.csv.
12 · The plan on the ground: farm practices as a share of the 2025 target
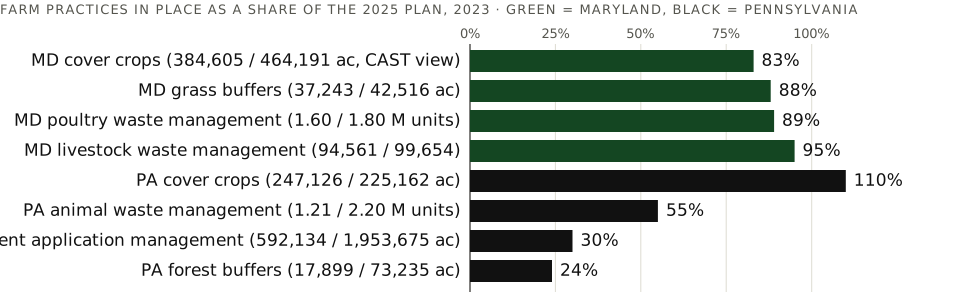
What it shows. EPA's 2024 evaluations of how much of each state's planned agricultural implementation was in place by 2023. Maryland is at 83–95 percent on its four largest lines; Pennsylvania has exceeded its cover-crop target but stands at 55 percent on animal waste, 30 percent on nutrient application management and 24 percent on forest buffers — the three practices that carry most of its 29-million-pound gap.
Sources. EPA, 2024 Maryland and Pennsylvania milestone evaluations (May 2024). Data: ex51-implementation.csv.
13 · Why counties build streams: cost per acre treated

What it shows. The reason stream restoration is the largest structural line in every Maryland county plan: on the permit's currency of acres treated, a restored stream costs about $84,000 an acre against $221,000 for bioretention, and a single Gaithersburg project ran $1.8 million for 2,400 feet. That arithmetic is sound under the crediting protocol; whether the stream is ecologically restored is the open question of Section VI.
Sources. Bay Journal, Oct 2020 ("Stream restoration techniques draw pushback"); King & Hagan 2011. Data: ex52-stream-vs-bio.csv.
14 · The bill by county: expected cost per impervious acre, FY2025–26
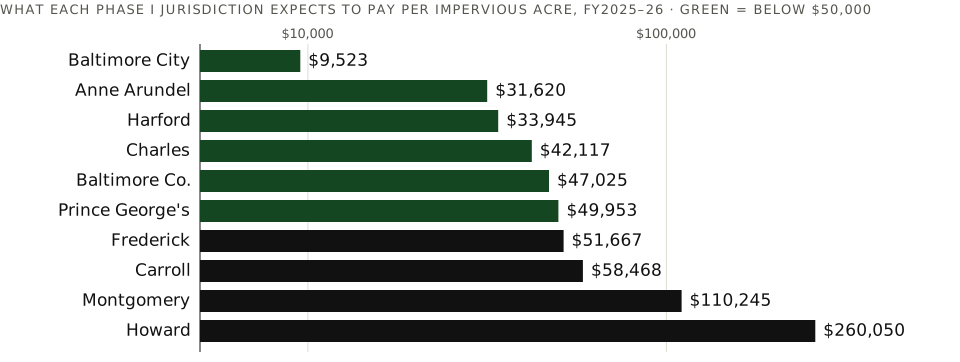
What it shows. What each Phase I jurisdiction projects it will pay per impervious acre over the next two years — a 27-fold spread from Baltimore City, which earns most of its acres by sweeping and cleaning what it already owns, to Howard, whose cheap acres are gone. The State average is $45,816. This is the single best predictor of where retrofit contractors' next decade of work sits, and at what margin.
Sources. MDE FAP report Oct 2025, Table 8. Data: ex13-md-phase1.csv.
VIIWhat works per dollar
The best cost data in the watershed come from the University of Maryland Center for Environmental Science, which in 2021 priced actual Maryland projects — the invoices, not the estimates — annualised them over their design lives at 5 percent, and divided by the pounds the Bay Program credits. The medians: a Maryland stormwater practice removes a pound of nitrogen for $1,558 a year and a pound of phosphorus for $9,639; a Maryland agricultural practice for $16 and $489. EPA's program office, from fifteen years of watershed-wide cost profiles, reaches the same order of magnitude: about $24 a pound for agriculture, $354 for stream and shoreline restoration, $2,259 for urban practices — "nearly 100 times that for agriculture," in EPA's words. Maryland's Bay Cabinet, reporting to its legislature, puts wastewater at about $40 a pound and as low as $10 with the operating incentive, septic at $130–330, stormwater at "$384 to more than $10,000." Three institutions, three methods, one answer.
Dollars per pound of nitrogen removed, by practice
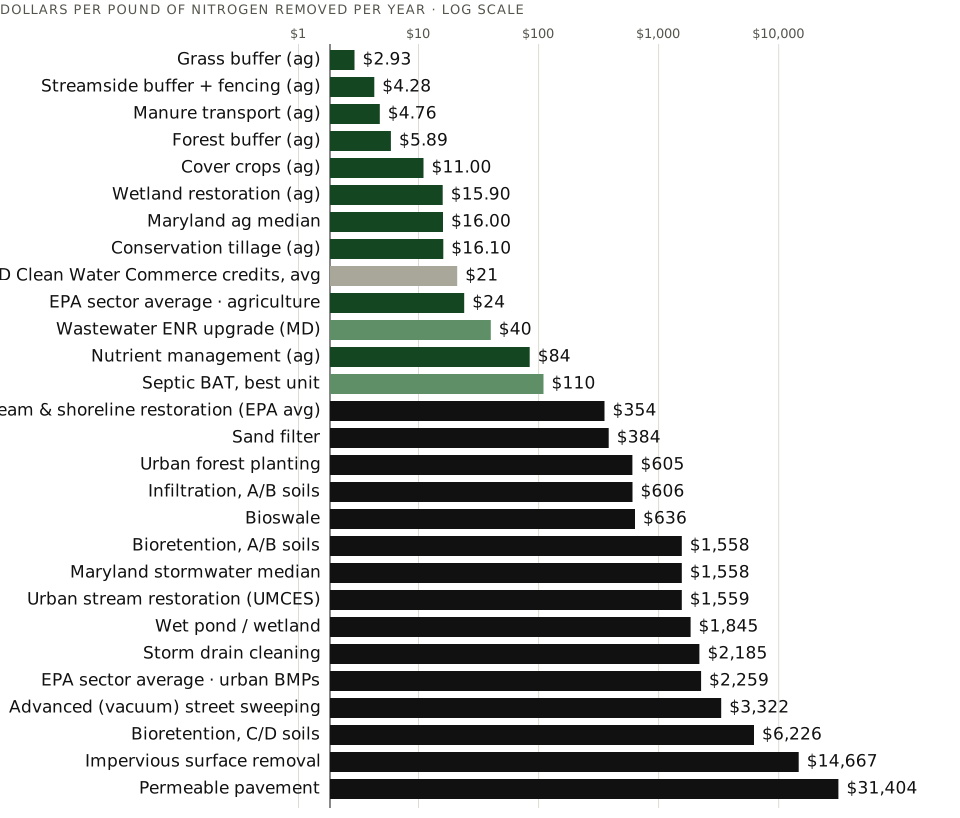
What it shows. Annualised cost (capital amortised over design life at 5 percent, plus operation and maintenance) per pound of nitrogen credited per year. Dark green is agriculture, light green wastewater and septic, black urban stormwater, stone a traded credit price. Log scale. UMCES values are 2017 dollars from Maryland projects; EPA sector averages are watershed-wide; the cover-crop figure is a 2013 Maryland legislative estimate. Street sweeping is the advanced (vacuum or regenerative-air) technology at one pass a fortnight; mechanical broom sweeping earns no nitrogen credit.
Sources. Price, Flemming & Wainger, UMCES TS-772-21 (2021), Tables 16 and 22; EPA CBPO, Most Effective Basins Funding Allocations Rationale (27 May 2021); MD DNR/Bay Cabinet SFY2024 spending report; MD DLS 2013; MDE BRF 21st report; MDE BAT ranking (Feb 2026). Data: ex23-cost-N.csv.
Dollars per pound of phosphorus removed, by practice
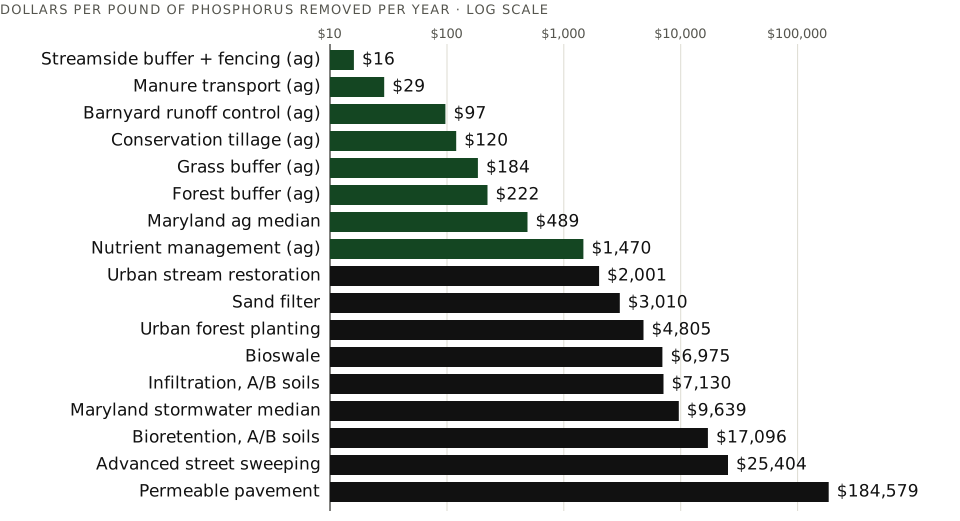
What it shows. The same construction for phosphorus, Maryland projects only. The gap is wider than for nitrogen because urban phosphorus loads per acre are small (2.55 pounds per impervious acre a year against 20.39 of nitrogen) while livestock practices intercept concentrated phosphorus.
Sources. UMCES TS-772-21 (2021), Tables 16 and 22, 2017 dollars. Data: ex24-cost-P.csv.
Within stormwater the spread is itself instructive. The cheapest structural practice per pound is the sand filter at $384, followed by infiltration on sandy soils, urban tree planting and bioswales in the $600s. Bioretention — the rain garden that has become the signature of the field — costs $1,558 on soils that drain and $6,226 on the Piedmont clays, where it needs an underdrain and behaves like a filter. Permeable pavement removes nitrogen at $31,404 a pound. Maryland's counties confirm the range from the other direction: their projected cost per impervious acre restored runs from $9,523 in Baltimore City to $260,050 in Howard, with the State median at $45,816.
The program-scale figure is starker. STAC found that Maryland's municipal permittees planned to spend $1.195 billion to remove 85,000 pounds of nitrogen a year — $14,000 per annual pound of capital, for 0.2 percent of the reduction the Bay needs. The 2014 USDA analysis found that paying farmers for delivered pounds rather than installed practices would cut the cost of the agricultural reduction from $1.26 billion a year to $55 million. Neither finding has been controversial for a decade; both remain, in the main, unimplemented.
VIIIWhat works per man-hour
Labour is where the published record thins out, and we say so. Nobody in the watershed publishes hours per pound. Two things can be measured honestly. The first is routine maintenance labour, which the University of New Hampshire tracked for two to four years on a set of full-scale practices: from 6 staff-hours per impervious acre treated per year for porous asphalt to 28.5 for a sand filter. Credit each practice at Maryland's default removal for its class and a pound of nitrogen costs between half an hour and four hours of a crew's time a year to keep flowing.
Nitrogen removed per hour of maintenance labour, urban practices
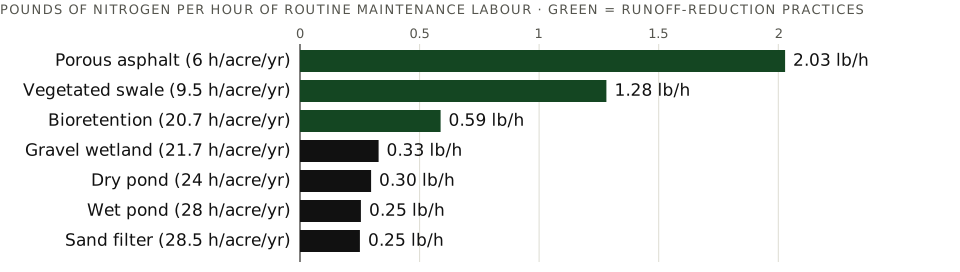
What it shows. Pounds of nitrogen credited per impervious acre a year (Maryland default load 20.39 lb/acre; runoff-reduction practices 59.7 percent, treatment practices 35.0 percent) divided by measured routine maintenance hours per impervious acre a year. This is O&M labour only — mowing, mulching, sediment removal, inlet clearing — not construction, design or inspection; it pairs New Hampshire field data with Maryland loading rates, and the second edition corrects the per-acre hours to the values Houle presented to EPA (the first edition had converted an approximate hours-per-hectare series). Treat it as an order of magnitude.
Sources. Houle, Roseen, Ballestero, Puls & Sherrard, J. Environmental Engineering 139(7), 2013 (range 14.8–70.4 h/ha), and Houle's EPA presentation (2017) for per-acre values; MDE, Accounting for Stormwater Wasteload Allocations (Nov 2021). Data: ex25-labour.csv.
The second measurement is cruder and more revealing. If every dollar of a practice's annual cost were a wage — none of it is, but the ratio says how much human effort a pound of nitrogen commands — then at a loaded $30 an hour for a landscape or construction labourer in the Washington–Baltimore market (Bureau of Labor Statistics means of $20.55 and $22.18, plus burden), the farm median of $16 a pound is about half an hour of work, the treatment plant's $40 an hour and a quarter, the stormwater median of $1,558 fifty-two hours, and permeable pavement a thousand. A retrofit contractor should read that not as an indictment but as a statement of where the value it delivers actually lies: in the hours themselves, in the flood it prevents and the stream it stabilises, and not in the pound of nitrogen it is nominally paid for.
Labour-equivalent hours per pound of nitrogen, at $30 an hour
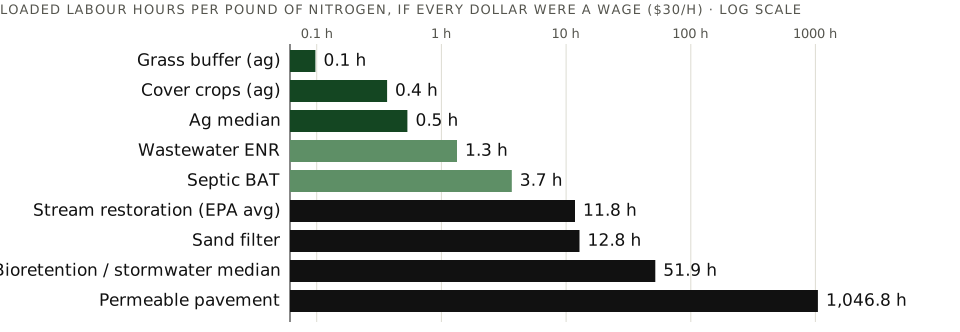
What it shows. Annualised cost per pound of nitrogen divided by a loaded wage of $30 an hour: a unit conversion, not a labour study, that expresses the hundredfold cost gap in the currency of a crew's time. The wage is our assumption, built on BLS Occupational Employment and Wages, May 2023, for landscaping and groundskeeping workers (SOC 37-3011, Washington metro mean $20.55) and construction labourers (47-2061, $22.18), with a 1.4 burden multiplier.
Sources. As the nitrogen cost exhibit; U.S. BLS OEWS May 2023. Data: ex26-labour-equiv.csv.
IXThe treadmill
The developed-land load rose about 1.5 million pounds of nitrogen a year between 2009 and 2023 while every other major sector fell, and the reason is on the ground. Between 2013 and 2021 the watershed added about 13,226 acres of impervious surface a year — twenty square miles annually, more than a hundred thousand acres over eight years — nearly two-thirds of it driveways, parking and other flatwork, fastest in the suburbs of Baltimore, Harrisburg, Richmond and Washington. Some 4,400 acres of solar arrays appeared in 2021–22 alone, two-thirds in Virginia. Community tree canopy fell a net 28,000 acres in the same period despite 17,082 acres planted. From 1990 to 2007 impervious area under single-family homes grew 34 percent while population grew 18 percent: the region paves faster than it grows.
Acres of pavement added each year against acres treated

What it shows. New impervious cover across the whole watershed per year (2013/14–2021/22 land-cover change) against the annual pace of impervious-acre restoration by the largest stormwater programs in the watershed. The Maryland figures divide cumulative acres by the years of permitting; the comparison is watershed-wide addition against state-level treatment, and is meant to show scale, not to suggest Maryland should offset the region.
Sources. Bay Journal and Maryland Matters, Oct 2025, reporting the USGS/CBP 2024-edition land cover; MDE FAP report Oct 2025 (46,782 acres both terms; 10,860 current); EPA G3 (Prince George's). Data: ex28-treadmill.csv.
The watershed's population, 1980–2050
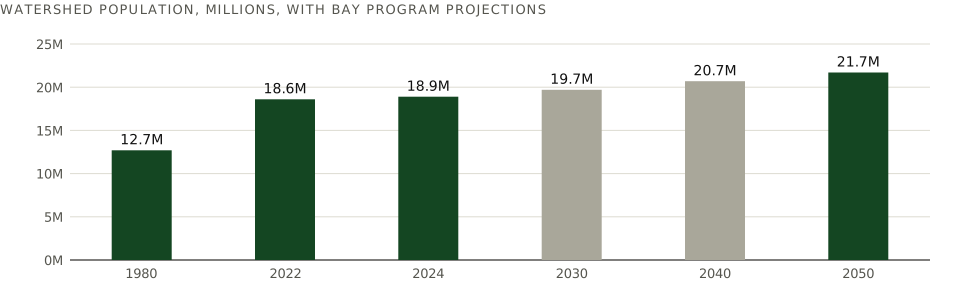
What it shows. Bay Program population figures with its projections (stone and green bars): 12.7 million in 1980, 18.9 million in 2024, 21.7 million by 2050 — a further 2.8 million people. Bhatt et al. (2023) found that population and land-use growth add less to nutrient loads than climate change in every scenario, but they add.
Sources. CBP, Population Growth and Development pages; Bhatt et al., JAWRA 2023. Data: ex35-population.csv.
Where Maryland will grow, 2020–2050
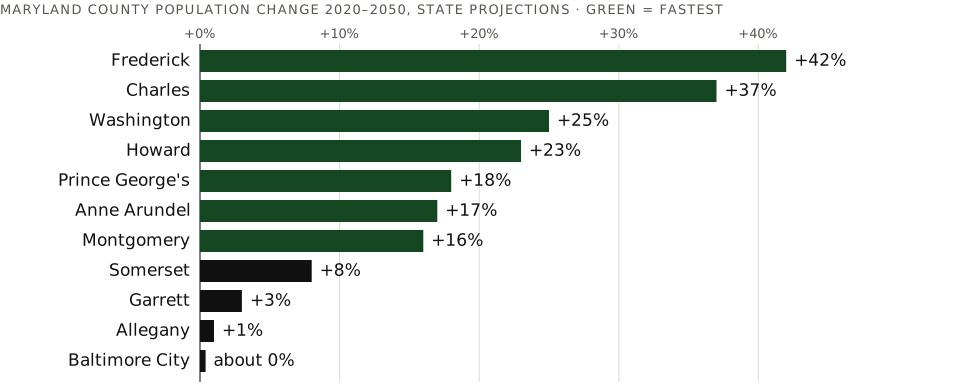
What it shows. Maryland Department of Planning projections (November 2025 vintage): Frederick from 271,717 to 386,720 people, Charles from 166,617 to 228,870, Washington and Howard by a quarter; Prince George's, Anne Arundel and Montgomery each add 100,000–170,000. Baltimore City, Allegany and Garrett are flat. Frederick County — the State's most farmland and its fastest growth, now with a 2,100-acre data-center campus — is where the next decade's pavement and the last decade's cover crops meet.
Sources. Maryland Department of Planning, Total Population Projections (Nov 2025); Bay Journal on data centers. Data: ex35b-md-county-growth.csv.
Regulation on new construction is the only lever that scales with the paving. Maryland's Stormwater Management Act of 2007, in force since May 2010, requires Environmental Site Design to the maximum extent practicable; the District's 2013 rule requires sites over 5,000 square feet to retain the first 1.2 inches of rain or buy the difference as credits; Virginia's Chesapeake Bay Preservation Act has held a 100-foot buffer in Tidewater since 1991. By Maryland's own loading rates, forest kept as forest avoids about 18 pounds of nitrogen an acre a year against pavement (20.39 against 2.31), permanently, with no maintenance crew. The partnership has protected 9.2 million acres, 23 percent of the watershed; the revised Agreement asks for 2 million more by 2040.
XThe big players
The restoration is often described as a partnership of seven jurisdictions and a federal office. In money and in work it is a much shorter list.
Who pays: FY2024 restoration spending
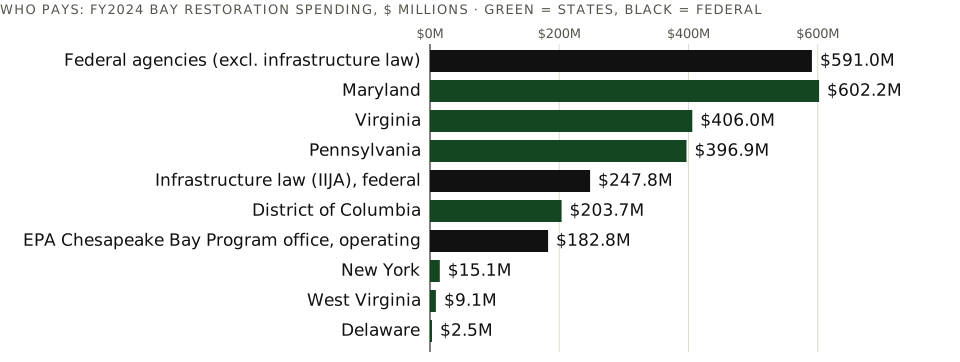
What it shows. The 2024 federal–state crosscut. Three states — Maryland, Virginia, Pennsylvania — put up $1.4 billion of the $1.45 billion state total; the federal government $591 million in regular appropriations plus $248 million of infrastructure-law money, of which the EPA program office's operating budget is $183 million and its coordinating appropriation $92 million. The District's $204 million is largely Clean Rivers. USDA's conservation programs in the watershed (EQIP $66.6 million, CSP $22.9 million, RCPP $4.8 million in FY2023) sit inside the federal line.
Sources. 2024 Chesapeake Bay Crosscut Report (Jan 2025); ChesapeakeProgress, Funding. Data: ex29-spending-fy24.csv.
| Player | Role | Scale, with source |
|---|---|---|
| Funders and regulators | ||
| EPA Chesapeake Bay Program Office | Coordinates the partnership; runs the model; evaluates milestones; holds the unused Clean Water Act backstops | $93M appropriation FY2026; ~100 staff, under a tenth lost in 2025; director departed Jan 2025 (Maryland Matters; Bay Journal) |
| Maryland (MDE, DNR, MDA) | Bay Restoration Fund, Trust Fund, MS4 permits, cost-share | $602M FY2024; $15.9B since 2000; BRF $2.33B collected since 2004; Trust Fund $782M state + $316M leveraged since FY2009 (Crosscut; DNR; MDE) |
| Virginia (DEQ, DCR) | Water Quality Improvement Fund, SLAF, ag cost-share | $406M FY2024; VACS $237.5M FY2025 and a record $304M cited in Aug 2026; WQIF >$1B since 1997 (Crosscut; RD61; CBP) |
| Pennsylvania (DEP, PENNVEST) | Countywide Action Plans, Clean Streams Fund, credit procurement | $397M FY2024; Clean Streams Fund $50M/yr; need $521M/yr; 945 miles of buffers and 1.5M trees claimed by Gov. Shapiro (Crosscut; PA DEP; CBP Aug 2026) |
| USDA NRCS | EQIP, CSP, RCPP farm conservation | $94M obligated in the watershed FY2023 (Crosscut) |
| NFWF Chesapeake Bay Stewardship Fund | Largest grant-maker | >$400M, ~2,000 grants since 1999; $44.2M + $31M match in 2026 for a projected 1M lb N/yr (NFWF) |
| Chesapeake Bay Trust | Maryland's grant-maker | >$130M, 14,000 awards since 1985 (CBT) |
| Builders | ||
| DC Water | Clean Rivers tunnels; Blue Plains ENR | ~$2.7B program; Anacostia and Northeast Boundary tunnels built by Webuild/Lane; Potomac tunnel $819M by Bouygues/Halmar, 2030; Blue Plains ENR $168M, >144M lb N avoided (DC Water; ASCE) |
| Corvias / Prince George's Clean Water Partnership | The largest stormwater P3 in the country | ~5,000 acres, 428 projects since 2015; $270M of procurement to local and minority firms (Harvard Extension study, July 2026) |
| Ecosystem Investment Partners | Mitigation and credit banking | >10 miles of Little Elk and North East creeks in Cecil County; 3,976 lb N/yr of credits (EIP) |
| HGS LLC | Pennsylvania credit generator | Won $12.5M of PENNVEST's $14.8M 2024 procurement (PENNVEST) |
| Ecotone | Maryland stream and wetland restoration | 12 employees in 2012 to 75 in 2020 (Ecotone). Revenue and project totals for the region's other restoration firms — EQR, Underwood, Biohabitats, KCI, RES, Meadville, Brightwater, Angler, WSSI — are not published and were not found |
| Oyster Recovery Partnership | Reef building | 14 billion oysters planted, >3,000 acres, 366,000 bushels of shell recycled (ORP) |
| Maryland State Highway Administration | The State's largest single MS4 permittee | >40,000 impervious acres; 6,127 acres restored under the prior permit; 4,092 (15%) required by 2030 at $216M (MDE Aug 2025) |
| Loaders | ||
| Delmarva poultry (Perdue, Mountaire, Tyson, Amick) | The Eastern Shore's nutrient balance | 628M chickens/yr, 4.7B lb, $4.6B, 1,225 growers, 4,814 houses (DCA 2025); integrator shares not published |
| Lancaster County agriculture | The single largest county load in the watershed | 25.7M lb N/yr; 1,286 of 1,432 stream miles impaired; 2025 plan 10M lb, 7.26M planned (Hourglass Lancaster / PA DEP) |
| Constellation / Conowingo Dam | Reservoir infill releases trapped nutrients | 6M lb N and 0.26M lb P/yr to offset; $340M settlement over a 50-year licence, Oct 2025 (EPA; Maryland Matters) |
| Baltimore City (Back River, Patapsco) | The largest recent point-source failure | +2.5M lb N in 2021; up to $4.75M penalty; $653M of ENR investment (CBF; MDE; Inside Climate News) |
| Richmond combined sewer | The largest remaining CSO in the watershed | ~1.8B gal/yr; $1.3B; statutory 2035 (James River Association; VPM) |
| Advocates and scientists | ||
| Chesapeake Bay Foundation | Litigation, advocacy, the "State of the Bay" | Revenue $35.4M, net assets $122M FY2025 (Form 990) |
| Chesapeake Conservancy · Alliance for the Chesapeake Bay · riverkeepers | Land protection, buffers, local watchdogs | Conservancy ~60 staff, >$45M LWCF secured FY15–24 (annual report) |
| UMCES · VIMS · USGS · STAC | The report card, the dead-zone forecast, the river gauges, the program's independent review | UMCES Report Card since 2006; VIMS forecast since 2007; USGS nine River Input stations since 1985; STAC's CESR (2023) and stream restoration review (2024) |
Sources as named in each row; full citations in Section XV.
The federal line, FY2008–FY2027
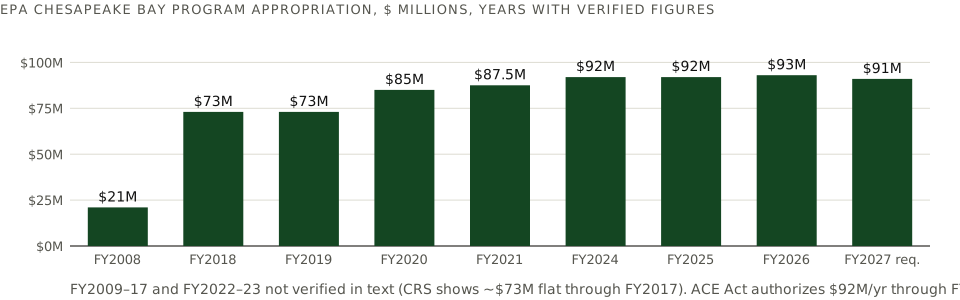
What it shows. EPA's Chesapeake Bay Program appropriation in years with a verified figure. It quadrupled between 2008 and 2020 and has been flat in real terms since; Congress has appropriated more than the White House requested in each of the last two cycles. The 2027 request trims it to $91 million inside a 52 percent cut to EPA and a 90 percent cut to the Clean Water State Revolving Fund that finances treatment plants.
Sources. Hoyer (2008); Harris (2018–19); Van Hollen (2020); Fauquier Times (2021, derived); ChesapeakeProgress; Maryland Matters 19 Jan 2026; CBF 3 Apr 2026. Data: ex30-epa-cbp.csv.
Maryland's state Bay budget, FY2022–FY2027
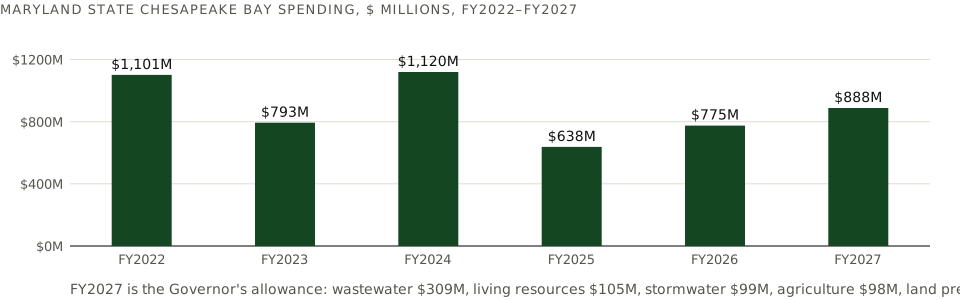
What it shows. Maryland's state-only Chesapeake Bay spending by fiscal year as tallied by the Department of Legislative Services: actuals through FY2025, the FY2026 appropriation and the FY2027 allowance. The dip in FY2025 reflects the timing of capital projects, not a policy change; the Trust Fund's competitive grants are being cut from $35.7 million to $23 million in FY2027 as the fund's balance runs down to $11 million.
Sources. MD DLS, Chesapeake Bay Overviews FY2026 and FY2027. Data: ex31-md-spending.csv.
XIThe long push, 1983–2040
The Bay effort is old enough to have a history, and the history explains the present. Each decade has ratcheted the machinery — a voluntary pledge, then a numeric goal, then a federal budget with a due date, then a court-tested one — while the biology has responded slowly and the politics have rewarded the cheapest pounds first.
- 1972Clean Water Act. Section 117, added later, creates the Chesapeake Bay Program Office within EPA.
- 1975–83Congress funds a $27 million, five-year EPA study at Senator Mathias's urging; it names nutrient over-enrichment as the primary cause of decline.
- 1983First Chesapeake Bay Agreement: a one-page pledge by Maryland, Virginia, Pennsylvania, the District, EPA and the Chesapeake Bay Commission.
- 1984–88Maryland's Critical Area Act (1984); Virginia's Chesapeake Bay Preservation Act (1988). USGS begins the River Input Monitoring network (1985); the first attainment assessment finds 26.5 percent of the Bay meeting standards.
- 1987Second Agreement sets the first number: a 40 percent cut in nitrogen and phosphorus by 2000.
- 1990–99EPA's Phase I (1990) and Phase II (1999) municipal stormwater permit rules.
- 2000Chesapeake 2000: 102 commitments; Delaware and New York join by memorandum, West Virginia in 2002. The 40 percent goal is missed.
- 2004Maryland enacts the Bay Restoration Fund — the flush tax — to pay for enhanced nutrient removal at 67 major plants.
- 2007Maryland's Stormwater Management Act requires Environmental Site Design to the maximum extent practicable; in full force May 2010.
- 2009Executive Order 13508 puts the federal government formally in charge of leadership and two-year milestones. The TMDL baseline year.
- 201029 December: EPA issues the Chesapeake Bay TMDL, the largest ever, with 2025 as the deadline and 2017 as the 60 percent midpoint. Phase I Watershed Implementation Plans.
- 2011–16The American Farm Bureau and home builders sue; the TMDL is upheld in district court (2013), by the Third Circuit unanimously (6 July 2015), and the Supreme Court declines review (29 Feb 2016). Maryland mandates stormwater fees in its ten largest jurisdictions (2012), raises the flush tax to $5 a month, then repeals the fee mandate (2015) in favour of biennial financial-assurance plans. Prince George's signs the Corvias partnership (2015).
- 2014Chesapeake Bay Watershed Agreement: ten goals and 31 outcomes, from oysters to public access, with the TMDL as its clean-water spine. Maryland's 20 percent impervious-restoration permits take effect.
- 2015–17Wastewater meets its 2025 limits ten years early. Attainment reaches its record, 42.2 percent (2015–17). Grasses reach 104,843 acres.
- 2018–19Midpoint assessment: nitrogen reaches only 40 percent of the 2017 target. Record rainfall in 2018–19 produces the highest river flows since gauging began in 1937; monitored nitrogen doubles; grasses fall 40 percent. Phase III WIPs are filed; Pennsylvania's is $324 million a year short. Maryland's Court of Appeals upholds the 20 percent permits against Carroll and Frederick (Aug 2019).
- 2020–21Maryland, Virginia, Delaware, the District and CBF sue EPA over Pennsylvania (Sept 2020). Baltimore's Back River and Patapsco plants fail; Maryland's wastewater nitrogen rises 2.5 million pounds. The Conowingo WIP is written to offset 6 million pounds. Maryland's new permits cut the restoration requirement to about 11 percent.
- 2022–23Pennsylvania's Clean Streams Fund puts $220 million of federal relief into farm conservation. The Pennsylvania suit settles (June 2023). STAC's evaluation concludes the nonpoint program is "insufficient" and the deep water is barely responding. The smallest dead zone on record. The District's Northeast Boundary Tunnel opens; Anacostia overflows fall 98 percent.
- 2024The 2023 progress run shows 57 percent of the nitrogen goal. STAC's stream-restoration review finds biological uplift "rare." The Beyond 2025 committee reports; the Executive Council orders the Agreement rewritten. The best report card in 21 years.
- 2025The deadline year. Federal grant freezes and staff losses at the program office in the spring; the appropriation survives. Maryland settles Conowingo for $340 million (October). The SHA permit is reissued at 15 percent (August). On 2 December the Executive Council adopts a revised Agreement: four goals, 21 outcomes, new load targets by 2030, all practices by 2040, a 2033 midpoint. Maryland and Virginia had argued for 2035. Governor Shapiro of Pennsylvania takes the chair.
- 2026Congress appropriates a record $93 million (January). The Phase 7 model is accelerated to 1 January 2027. The final 2025 scorecard, 6 August: 57, 90 and 100 percent. Maryland's four largest county permits expire in November.
- 2027–33Phase 7 model (2027); a TMDL reconsideration STAC expects in 2027; Virginia's 100 percent MS4 deadline (Oct 2028); the District's permit (Dec 2028); revised load targets and Maryland's flush-tax statute change (2030); the Potomac tunnel (2030); the Agreement's midpoint (2033).
- 2035–40Richmond's combined-sewer deadline; the Agreement's habitat outcomes (2035); STAC's proposed climate reassessment (2035); all practices in place (2040) — 57 years after the first Agreement.
XIIWhat the future will do
The program has now modelled its own future in enough detail to be quoted. What the models say, in order of confidence: it will rain more and harder; the water will warm; the sea will rise; the population will grow; the loads will rise from climate alone; the dead zone will grow unless the loads fall faster than the climate pushes them up; and the cheapest reductions have already been made.
Climate alone: what the model adds to the job
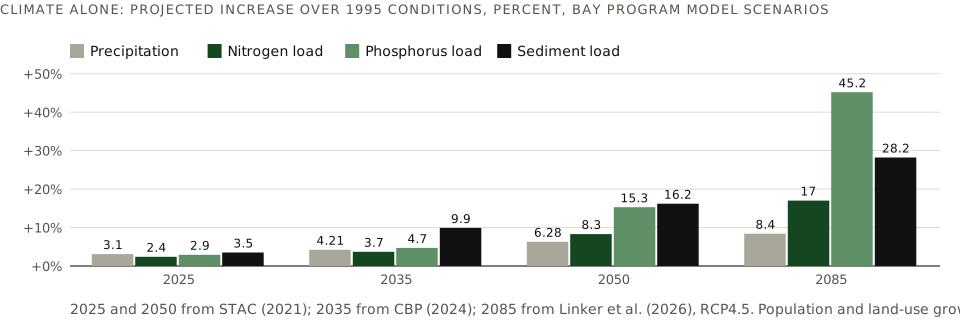
What it shows. Projected increases in precipitation and in nitrogen, phosphorus and sediment loads over 1995 conditions, from climate change only, in the Bay Program's watershed model. The 2025 adjustment (+2.4 percent nitrogen) became the "5 million pounds harder" figure in the WIPs; 2035 adds another 5 million; by 2050 the model puts the nitrogen penalty at 8.3 percent and phosphorus at 15 percent. Linker et al. (2026) carry it to 2085 under RCP4.5. A USGS analysis dissents, finding warming alone could reduce nitrogen delivery 6.5 percent over 30 years through denitrification; the disagreement is live.
Sources. STAC, Climate Change Modeling 2.0 (2021); CBP, Climate Change Impacts Beyond Midcentury (July 2024); Linker et al., Climate 14(3):66 (2026); Bhatt et al., JAWRA (2023); Bay Journal, Feb 2024. Data: ex32-climate.csv.
How much harder it will rain
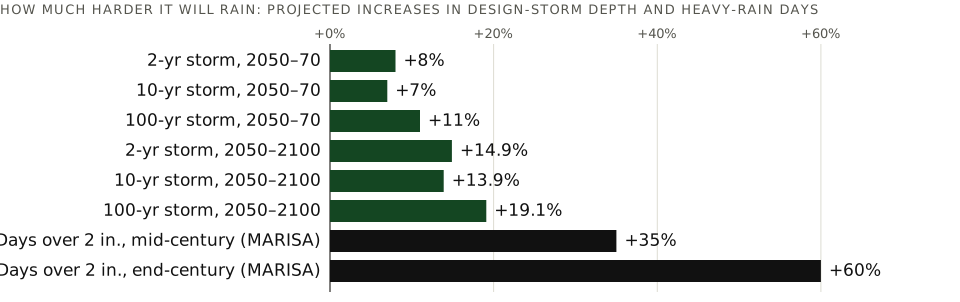
What it shows. Maryland's A-StoRM analysis (RAND, for MDE) of 24-hour design storms at the Annapolis station under RCP8.5: the 100-year storm grows 11 percent by 2050–70 and 19 percent by 2050–2100; the ordinary 2-year storm — the one every stormwater practice in the State is sized for — grows 8 and 15 percent. MDE used the same work to propose an 11 percent larger design storm (2.7 to 3.0 inches) for Environmental Site Design. The Mid-Atlantic RISA projects days with more than two inches of rain up 35 percent by mid-century and 60 percent by its end. NOAA Atlas 15, which will replace the 2004-era Atlas 14 with climate-adjusted rainfall statistics, is due in preliminary form for the lower 48 by September 2026 and in final form in 2027.
Sources. MDE, A-StoRM report; MARISA extreme-precipitation projections; NOAA Atlas 15 program page. Data: ex33-rain.csv.
The rising Bay
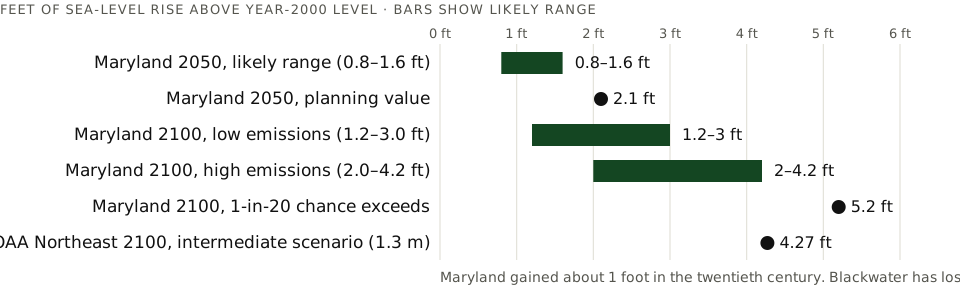
What it shows. Maryland's 2023 sea-level projections (UMCES for the Maryland Commission on Climate Change), feet above the year-2000 level, with NOAA's 2022 intermediate scenario for the Northeast for comparison. Hampton Roads is also sinking 2.3 millimetres a year. NOAA projects Norfolk's high-tide flooding days rising from 13 in 2021 to 85–125 by 2050; Annapolis, at about 50 tidal floods a year now, could see 180 by 2030. The National Wildlife Federation's marsh model loses 161,000 acres of brackish marsh baywide at 69 centimetres of rise, 92 percent of Blackwater's.
Sources. UMCES, Maryland Sea-Level Rise Projections 2023; NOAA, Sea Level Rise Technical Report (2022); Virginia Tech/USGS/NGS subsidence study (Feb 2026); NOAA high-tide flooding outlook; UCS Annapolis; NWF SLAMM; NOAA Climate.gov on Blackwater. Data: ex34-slr.csv.
What the living Bay is projected to lose
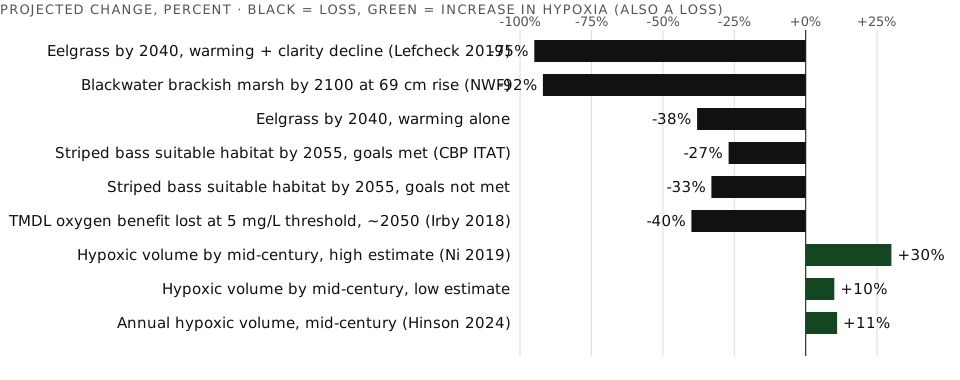
What it shows. Published projections for the Bay's biology under warming and sea-level rise, percent change from the stated baseline. Eelgrass, the Bay's cold-water grass, is the most exposed: Lefcheck et al. project a 38 percent loss from warming alone by 2040 and 95 percent if water clarity also declines, at an economic cost of $1–2 billion; STAC's 2020 temperature report says it "will likely be extirpated" without clarity gains. Striped bass lose 27 percent of suitable summer habitat by 2055 even if the restoration goals are met. Hypoxia grows 10–30 percent by mid-century in Ni et al., 9–19 percent in Hinson et al. depending on method; Irby et al. find warming erases about 40 percent of the TMDL's benefit at the 5 mg/L oxygen threshold. Blue crabs are the one species most models favour.
Sources. Lefcheck et al. 2017 (VIMS); NWF SLAMM; CBP ITAT, striped bass habitat (Feb 2023); Irby et al., Biogeosciences 2018; Ni et al., JGR Oceans 2019; Hinson et al., Scientific Reports 2024; STAC, Rising Temperatures (2020). Data: ex37-living.csv.
The policy calendar
The revised Agreement's numbers, as adopted or as drafted for comment, are smaller than the ones they replace. Tidal wetlands: 1,000 acres restored and 15,000 enhanced by 2035, against 85,000 and 150,000 in 2014. Forest buffers: 7,500 acres a year by 2035. Community trees: 35,000 acres by 2035. Oyster reef: 2,000 more acres by 2040. Land: 2 million more acres by 2040. Water quality: "continue implementing through 2030" and revise the targets by then, on the Phase 7 model due 1 January 2027. The program's own outcome memo of November 2024 projects, at 2009–2023 rates, nitrogen attainment around 2036 and phosphorus around 2034 — which is to say the 2040 deadline is the current trend, not a plan to beat it.
Money is the variable. The ACE Act authorises $92 million a year for the program office through FY2030 and Congress has so far appropriated above it; the 2027 request would cut the state revolving fund that built the treatment plants by 90 percent. Maryland's flush tax faces a statutory change on 1 July 2030 and its Trust Fund's competitive grants are being cut by a third. Pennsylvania's gap is $324 million a year; over the fifteen years to 2040 that is $4.9 billion the State has not yet found. Virginia's 100 percent MS4 requirement lands in October 2028; Maryland's four largest permits are renegotiated this autumn, with the SHA permit's 15 percent read by the counties as the template. No jurisdiction has yet published a cost to reach the 2040 targets. The Chesapeake Bay Foundation's 2014 estimate of the whole Blueprint was about $5 billion a year; extrapolated to 2040 that is $75 billion, against a claimed $22.7 billion a year of additional natural benefits when the Bay is restored.
| Item | Value | Basis |
|---|---|---|
| Nitrogen still to remove, 2025 | 33.2 M lb/yr | 252.7 − 219.5, CBP Aug 2026 |
| Added by climate by 2035 | about 5 M lb/yr | CBP 2020 adjustment, second tranche |
| Added by Conowingo infill | 6 M lb/yr | EPA CWIP expectations 2023 |
| Effective job to 2040, before growth | about 44 M lb/yr | Sum of the above (our arithmetic) |
| Cost at the agricultural median | about $0.7 B/yr | 44 M × $16 (UMCES 2021) |
| Cost at EPA's agricultural average | about $1.1 B/yr | 44 M × $24 |
| Cost at the Clean Water Commerce price | about $0.9 B/yr | 44 M × $21 |
| Cost at the stormwater median | about $69 B/yr | 44 M × $1,558 |
| Pennsylvania's stated annual shortfall × 15 years | $4.9 B | $324 M × 15 |
| Nonpoint reduction actually achieved, 2010–2021 | about 3 M lb/yr | STAC CESR 2023 |
| Years to the job at that pace | about 150 | 44 ÷ 0.3 per year (our arithmetic) |
These are unit-cost extrapolations, not engineering estimates: the cheap pounds are not infinitely available, prices rise as the easy practices are used up, and pounds are not fungible across basins. The table is meant to show the order of magnitude of the choice, which is a factor of a hundred.
XIIIWhat we would do
The evidence supports a program that would look very different from the one the region runs, and we would argue for it in this order.
- Buy pounds, not practices. Every jurisdiction with a stormwater obligation should be allowed — and where its permit forces it, required — to meet a substantial share of its Bay nutrient obligation by purchasing verified reductions from the cheapest source in its basin, at prices Maryland's own purchases show are around $20 a pound. Maryland holds 1.36 million pounds of certified credits with too few buyers. Restricting trading is a decision to pay a hundred times more per pound.
- Finish the point sources, then the septics. Princess Anne, Richmond's combined system on its 2035 schedule, the Potomac tunnel in 2030, and the conventional septic systems within reach of tidal water are the last large, permitted, verifiable pounds in the watershed at $40–330 each — and the one sector where the river confirms the model.
- Pay farmers for measured outcomes, concentrated where the load is. Lancaster and York in Pennsylvania, Sussex in Delaware, and Maryland's nine Eastern Shore counties hold nearly all the remaining controllable nitrogen. Buffers, fencing, manure transport and cover crops cost $3 to $16 a pound. Verification is the whole problem — STAC is explicit that credited practices have not shown up in the streams as expected, and cover crops planted late as wheat deliver a third of their credit — so pay on monitored edge-of-field and small-watershed results, not on installed acres, and accept the twenty-year groundwater lag rather than pretend it away.
- Hold the line on new pavement, and size for the rain that is coming. The one practice that costs the public nothing is not building the runoff. ESD standards, on-site retention rules like the District's, forest-conservation offsets and canopy targets should be treated as the primary stormwater program, and the retrofit as the remedy for what those rules failed to prevent. Adopt MDE's 11 percent larger design storm now rather than after Atlas 15 makes it unavoidable; Frederick and Charles are about to be built.
- Re-justify the retrofit on its real merits. Stormwater retrofits in the built environment are worth doing — for flooding, for stream channels eating into back yards and sewer lines, for the Anacostia and the Jones Falls and the Elizabeth, for canopy and heat. Those are local benefits, and local governments should score, fund and defend them as such. Charging them to the Bay's nitrogen account at $1,558 a pound makes them look like the worst investment in the watershed when they are in fact a different investment. Within the retrofit budget, prefer sand filters, infiltration, swales and trees on soils that drain; be honest that bioretention on Piedmont clay is a filter that costs four times as much; stop building permeable pavement for nutrient credit; and hold stream restoration to an ecological outcome, not a protocol.
- Fund maintenance as a first-class line. Every credited pound assumes a working practice. Maryland and the District document inspections on 63 percent of tracked practices. A program that builds and does not maintain has, on the historical failure rates, a half-life of about five years. Triennial inspection, a maintenance reserve of 8–13 percent of capital a year, and certified crews are cheaper than the rebuild — and are the part of this industry's work that is unambiguously worth its hours.
- Stop scoring dry years. The Bay Program should report attainment and hypoxia flow-adjusted, so that a 31-percent-below-average dead zone in a 32-percent-below-average flow year is reported as what it is. Fifteen years of deadlines have taught the region to celebrate weather.
A note on our interest. This firm's principal works in the stormwater and landscape construction trade, and the retrofit is part of how that trade makes its living. We have written the numbers as the sources give them. The conclusion that the retrofit's value lies outside the Bay's nitrogen ledger is not a retreat from the work; it is the argument for funding it honestly.
XIVWhat we could not verify
The following were sought and either not found in a primary source, found only in secondary coverage, or found only in a form we could not read. None is used as a load-bearing figure.
- A jurisdiction-by-jurisdiction table for the 2025 progress run. The Bay Program's 6 August 2026 release gives watershed totals and, in a quotation, Maryland's 99/100/100; Pennsylvania's, Virginia's and the others' 2025 figures are not in text.
- Maryland's county-level 2025 nitrogen and phosphorus targets. They exist in the Phase III WIP's Appendix C, but pages C-3 to C-49 are page images and the State's server refuses downloads to this environment; the basin table is used instead. The 2012 Phase II county targets exist but are on a superseded model and are not comparable.
- Impervious acreage for the six Phase II counties; septic-system inventories and unit counts by county (the fund reports dollars); Howard's and Charles's current fee rates; the Trust Fund's dollars by county (the DNR report shows it only as a chart).
- The full attainment series for 1986–88 through 2011–13, which is published only in the interactive indicator; VIMS hypoxia values before 2019 on the current model vintage; MD DNR summer-average hypoxia for most years before 2020; SAV totals for 1985–2001 and 2003–04.
- The Bay Program's own press release for the 2021/22 land-cover totals (the 13,226 acres a year is reported by the Bay Journal and Maryland Matters from USGS's 2024-edition data); impervious acres by state.
- The 2026 UMCES report card (2025 data) and the 2025 SAV survey, neither published at the time of writing; the 2026 Executive Council meeting.
- Verbatim per-hectare maintenance hours for five of the seven Houle practices (the range 14.8–70.4 is verbatim; the per-acre values are from the authors' EPA presentation).
- EPA Chesapeake Bay Program appropriations for FY2009–2017 and FY2022–23 in text form; Maryland's state Bay spending before FY2022 as an annual table.
- The six practices and per-pound costs in the Chesapeake Bay Commission's 2004 Cost-Effective Strategies (a scanned PDF); cost-per-pound figures for green roofs, precision feeding or Clean Air Act rules; the "$30–40 billion" cost-to-finish figure sometimes attributed to the Commission, for which no source was found.
- Labour hours per acre for cover-crop planting, riparian planting with containerised stock, or street-sweeping productivity per curb mile; firm-level revenues or project totals for the region's restoration contractors; poultry-integrator market shares.
- Station-specific NOAA 2022 sea-level values for Baltimore, Annapolis and Norfolk (regional Northeast values are used); Tian et al. (2022) hypoxia figures; the precise content of the 2030 amendment to Maryland's Bay Restoration Fund statute, which we describe as a "change" rather than a sunset.
- The Bay Program's "2024 BMP verification findings" as a document; Anne Arundel's pay-for-success stream outcomes; Virginia's statewide MS4 reductions and the SLAF cumulative total; Pennsylvania's PRP percentages from DEP's own pages (its site blocks fetching).
XVSources
Chesapeake Bay Program. Press releases: 6 Aug 2026 (2025 progress); 19 May 2026; 4 Mar 2026; 15 Jan 2026; 2 Dec 2025; 3 Sept 2025; 5 Aug 2025; 3 June 2025; 31 Oct 2024; 12 June 2024; 2 May 2024; 26 Sept 2023; 16 Aug 2023; 9 May 2023; 14 Sept 2022; 22 June 2022; 10 Aug 2020; 13 May 2020; 26 Mar 2019; July 2018; 21 Sept 2016. Pages: Bay Facts; Stormwater Runoff; Chemical Contaminants; Development; History; Phase 7 model; WIP outcome memo, Nov 2024; Climate Change Impacts Beyond Midcentury (2024); ITAT striped bass (2023); CBAT BMP inspection presentation. ChesapeakeProgress, WIPs; Water Quality; Funding; Climate.
EPA. TMDL fact sheet; Key Developments; Wastewater reduction; Most Effective Basins rationale (2021); Maryland 2024 evaluation; Pennsylvania 2024 evaluation; 2023 settlement; Conowingo expectations; Virginia trading case study (2024); G3: Prince George's; WIFIA Alexandria; 2026–27 milestone expectations; 2024 Crosscut Report.
STAC. CESR (2023); 23-003, Evaluation of Management Efforts (2023); Stream restoration review (2024); Climate Change Modeling 2.0 (2021); Rising Temperatures (2020); A Path Forward (2025).
Maryland. MDE: Stormwater FAP report, Oct 2025 (FY24); FAP report 2024 (FY23); FAP report 2020; county FY24 FAPs (Anne Arundel, Baltimore City, Montgomery, Prince George's, Baltimore County, Harford); MS4 permits; SHA permit determination, Aug 2025; MS4 Accounting Guidance (2021); Bay Restoration Fund 21st report (Jan 2026); BRF 20th report (Jan 2025); Clean Water Commerce selections (Feb 2025); CWCA awards May 2026; BAT ranking (2026); Phase III WIP Ch. IV; UMCES TS-772-21, BMP costs (2021); Bay Cabinet SFY2024 spending report; 2024–25 milestones; 2024 Integrated Report; A-StoRM; Back River/Patapsco settlement. DNR: Trust Fund FY24–26 report; 11 Aug 2026; 8 July 2025; 3 Dec 2025; 28 Nov 2023; 18 May 2026; Winter Dredge Survey. MDA: Conservation Grants FY2024; Nutrient Management FY2025. DLS: Chesapeake Bay Overview FY2027; FY2026; Population 2024; Restoration Strategies (2013). MDP: Population projections; Farms 2022. Courts: MDE v. Carroll County (2019). Fee pages: Montgomery; Prince George's; Anne Arundel; Baltimore City.
Virginia, Pennsylvania, District. Virginia RD61 (2026); 9VAC25-890-40; VMRC blue crab 2025; VIMS aquaculture 2025; PA DEP WIP background; PA DEP 12 Dec 2025; PENNVEST 2024; Hourglass Lancaster; DC Water Clean Rivers; Potomac tunnel; Blue Plains nitrogen; ASCE (2023); TNC SRC market (2024); James River Association; VPM (Richmond); City of Lancaster; Philadelphia Water.
Science. USGS, Measuring loads; USGS RIM summary 2024; USGS WY2019; USGS groundwater lag (Sanford & Pope); Sabo et al. 2022; Zhang et al. 2018; Bhatt et al. 2023; Linker et al. 2026; Irby et al. 2018; Ni et al. 2019; Hinson et al. 2024; Hinson et al. 2022; Lefcheck et al. 2017 (VIMS); Yeo et al. 2014; Hively et al. 2025; Boynton et al. 2014 (Mattawoman); Harris Creek study; Houle et al. 2013 and EPA presentation; Walsh et al. 2017 (property values); VIMS dead zone 2025; VIMS SAV 2025; UMCES report card 2025; ecoreportcard archive; UMCES sea-level 2023; NOAA SLR 2022; NOAA Atlas 15; MARISA; NWF marsh report; Climate.gov, Blackwater; USDA ERS ERR-166 (2014); USDA 2022 county profiles; BLS OEWS 37-3011, 47-2061; USGS acre-inch.
Organisations and firms. NFWF 2026; Chesapeake Bay Trust; CBF Form 990; CBF 3 Apr 2026; CBF on the ACE Act; CBF 2022 (Baltimore plants); CBF economic benefits (2014); Chesapeake Conservancy 2024; Oyster Recovery Partnership; Ecosystem Investment Partners; Ecotone; Harvard Extension / Corvias (2026); Water Online; EPIC on CWCA; Delmarva Chicken Association; Chesapeake Bay Commission fact sheet; CBC/RTI trading study (2012); CBLP; WKU stormwater utility survey 2024; Pagnoncelli & Hunter 2026; Green Finance Institute.
Press of record. Bay Journal: May/June 2024; Oct 2025 (pavement); Feb 2024 (climate); Nov 2020; 2020 (stream restoration); data centers; Conowingo. Maryland Matters: 19 Jan 2026; 8 Oct 2025; 22 Aug 2025; 5 Jan 2026. Inside Climate News, 4 Dec 2025; 3 July 2022; Greater Greater Washington, 13 Aug 2025; WEF Stormwater Report, Nov 2023; Baltimore Banner; WHRO, Feb 2026; CoastTV, Aug 2026; Circle of Blue, 2024.
Method. Figures are quoted as published; dollar-years are stated where sources give them and are not inflated to a common year. Where we computed a figure it is marked as ours in the exhibit note. Each exhibit's data is available as a CSV of the name given in its note; the full set is filed with the research package. Second edition, September 2026: adds the year-by-year series, the Maryland county ledger, the methods and players sections, and the projections, and corrects the first edition's per-acre maintenance hours, its street-sweeping label, and the attribution of the District's captured-overflow figure. Higgins Strategy is registered and disclosed; one principal is in every meeting; we never take both sides of a matter.
Read next
- Every Federal Job in the Region What happened to the federal payroll in Washington, Maryland and Virginia between January 2025 and August 2026.
- Every Dollar to the Bay Where the money for the Chesapeake restoration comes from, which agency holds it and who is paid to do the work.
- What the Region Makes The economies of the District, Maryland and Virginia by industry since 1997, and how much of each is federal.