Study VII · The Capital Region
Every Dollar to the Bay
Where the money for the Chesapeake restoration comes from, which agency holds it and who is paid to do the work.
The short version
- There is no single "federal Bay number." The $93 million everyone quotes is the EPA Bay Program line. All EPA spending in the watershed was $183 million in 2024; all federal agencies, $591 million; add infrastructure-law money and it is $839 million. Confusing the four is the most common error in Bay reporting.
- USDA, not EPA, is now the largest federal funder — $266 million in 2024 against EPA's $183 million. Almost all of it flows through generic Farm Bill programmes, not a Bay-specific line: the dedicated USDA Chesapeake line has shrunk from roughly $44 million a year under the 2008 Farm Bill to about $3.3 million.
- Seventy-five percent of EPA's largest Bay grant is allocated by a fixed political split — 20 percent each to Maryland, Pennsylvania and Virginia, 10 percent each to the other four — that does not move with pollution load, acreage, or results. Only 25 percent is performance-weighted, and that has a floor.
- EPA's one genuinely performance-allocated pot, "Most Effective Basins," put 24 of its top 29 basins in Pennsylvania and gave Pennsylvania 62 percent of the money in 2020. By the 2022 infrastructure round, an equity overlay had cut Pennsylvania's share to 37 percent.
- The headline appropriation is stable; the money that actually builds things is not. While the Bay Program line moved a few percent, the Bay share of the Clean Water State Revolving Fund went from $89 million to a proposed zero, Army Corps spending fell 71 percent in a year, and infrastructure money fell from $298 million to $49 million.
- Infrastructure-law money is being allocated far faster than it is being spent: of $247.8 million allocated in 2024, 28 percent was obligated and 19 percent actually went out the door.
- The three states run structurally different machines. Maryland taxes ratepayers directly ($2.19 billion collected since 2004 from a $5-a-month flush tax). Virginia pays out of general-fund surplus, mostly as reimbursement to sewage utilities and farmers. Pennsylvania has no dedicated Bay revenue at all — and publishes its own $324 million annual shortfall on a government web page.
- Maryland's Chesapeake Trust Fund is being spent down: closing balance $48 million, then $23 million, then $11 million. The competitive round that local governments and nonprofits actually compete for is cut by $12.7 million in FY2027.
- Virginia has committed up to $1.14 billion of reimbursement to a single utility — the Hampton Roads Sanitation District, capped at $190 million a year through 2031 — while its urban stormwater cost-share programme runs at $2 million.
- Money moves four ways: formula grant, competitive grant, revolving loan, and outcome purchase. The loan is by far the largest ($231 million in one Maryland year) and the outcome purchase by far the smallest — but the outcome purchase is the only one that pays for results.
- Prices for a purchased pound of nitrogen span three orders of magnitude in the same programme: $14 for the best Maryland farm project, $311 and $521 for two stream restorations contracted in 2026, $2,176 for a shoreline. Pennsylvania's 2025 purchase priced at $645.
- In Prince George's County, the private partner's incentive fee is scored 35 percent on acres delivered and 35 percent on local hiring and minority-business participation. The programme reports $329.6 million spent and 4,658 credit acres — about $70,760 an acre, against the county's own pre-partnership estimate of $80,000.
- The finding that matters most for anyone bidding this work: "HGS, LLC," which has won 81 percent of Pennsylvania's flagship pay-for-results purchases — $22.6 million of roughly $28 million across three rounds — is registered with Florida's engineering business registry under the trade name RES Environmental Operating Company, at the Bellaire, Texas headquarters address of Resource Environmental Solutions, the KKR- and Onex-backed firm that calls itself the country's largest ecological restoration company. Pennsylvania's announcements name only "HGS, LLC."
- The same firms bank the credit, design the project, build it, and monitor it. One Maryland company advertises mitigation-credit sales and design-build in the same brochure. Maryland has certified nine trades since 2018; EPA's own guidance notes that claims on restoration financial assurances are rare. The safeguards exist on paper and are almost never tested.
- Everything expires at once. Maryland's four largest stormwater permits expire in November 2026, its flush-tax statute changes in 2030, its bonds retire in 2030; Virginia's 100 percent stormwater deadline lands in October 2028 and its utility cap ends in 2031; the infrastructure money is gone; and the restoration deadline is now 2040.
IHow to count the money
Study VI asked what a pound of nitrogen costs. This one asks where the money comes from, who decides who gets it, and who is holding the contract when it is spent. The first thing to establish is that there is no single number, and that most public argument about Bay funding is conducted by people using different ones.
Four figures circulate for federal fiscal year 2024, and they measure four different things. The EPA Chesapeake Bay Program line — the number in every press release and every advocacy alert — was $92 million. All EPA spending in the watershed, which adds the Bay-attributed shares of the Clean Water State Revolving Fund and the section 319 and 106 grant programmes, was $182.75 million. Every federal agency together, on regular appropriations, was $591.05 million. Add the infrastructure law and the federal total was $838.85 million. Against roughly $1.45 billion of state spending, the federal share of the ~$2 billion total is about 29 percent.
Four ways to count the same year
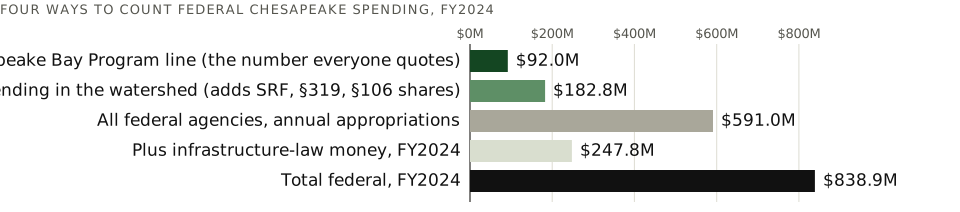
What it shows. Federal Chesapeake spending in FY2024 on four definitions. Each is correct; they are not interchangeable, and a claim that Bay funding rose or fell should always name which one it means.
Sources. 2024 Chesapeake Bay Crosscut Report, Tables 1 and 8; ChesapeakeProgress, Funding. Data: ex01-three-numbers.csv.
There is a second counting trap, and it has produced published claims of a funding collapse that never happened. The Chesapeake Bay Crosscut Report — the OMB-prepared inventory of federal spending mandated by the Chesapeake Bay Accountability and Recovery Act — is issued in editions, and in every edition the final column is the President's budget request, not an enacted or actual level. Chain the last columns of successive editions and FY2020 EPA appears as $71 million; take the same year from the later edition and it is $229 million. Every figure in this study is taken from the latest edition that reports the year.
Federal budget authority in the watershed, 2014–2024
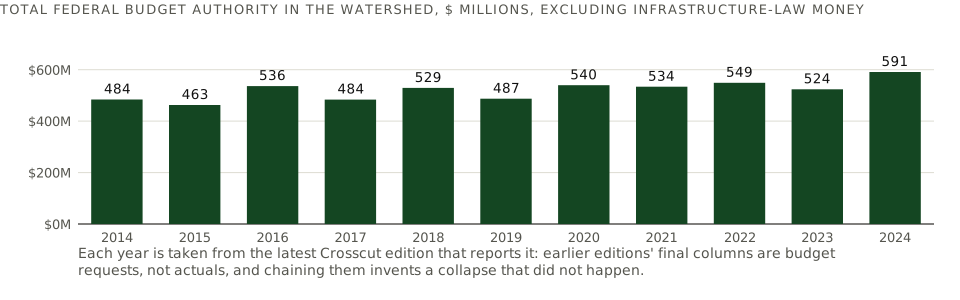
What it shows. Total federal budget authority across all agencies, excluding infrastructure-law money, each year taken from the latest Crosscut edition reporting it. The trend is a slow real-terms plateau with a 2024 step up, driven almost entirely by USDA.
Sources. Chesapeake Bay Crosscut Reports: FY2014–17, 2019, 2020, 2022, 2024. Data: ex02-federal-total.csv.
IIThe federal machine
Six agencies do essentially all of it. USDA overtook EPA as the largest federal funder in 2023 and pulled well ahead in 2024, at $266 million against $183 million. Defense spending is real but lumpy — installations and their own stormwater obligations. The Army Corps line is the one to watch: it fell 71 percent between 2023 and 2024, from $44.1 million to $14.8 million, which is the funding cliff behind the region's oyster-reef construction programme, itself a roughly $115 million federal build across ten tributaries in Maryland and Virginia.
Who spends it: federal agencies, 2018–2024
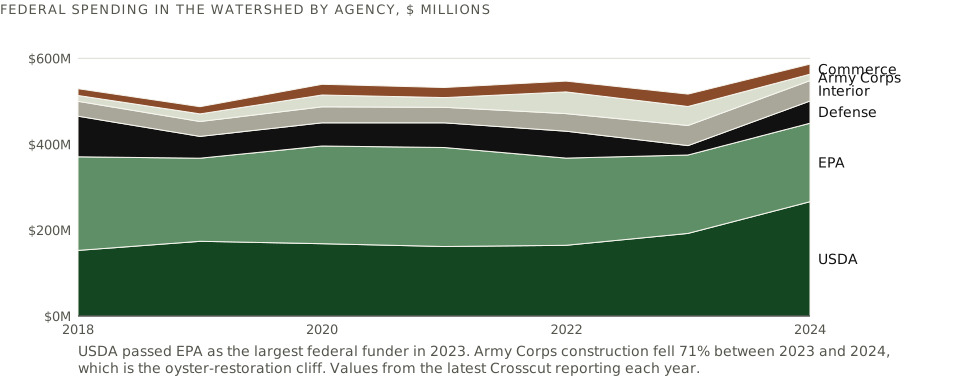
What it shows. Federal budget authority by agency, stacked, $ millions. USDA's rise reflects Farm Bill conservation programmes — chiefly EQIP and CSP — not a Bay-specific appropriation. Values are taken from the latest Crosscut edition reporting each year, which is why FY2022 and FY2023 differ from figures published in the 2022 edition.
Sources. 2024 Crosscut for FY2022–24; 2020 Crosscut for FY2018–21. Data: ex03-agency-series.csv.
| Agency / bureau | FY2024, $M | What the money is | How it is awarded |
|---|---|---|---|
| USDA | 265.99 | Farm Bill conservation in the watershed | Producer contracts through NRCS state offices |
| — EQIP | 51.83 | Cost-share for practices on working land | Ranked applications, state technical committee priorities |
| — Conservation Stewardship Program | 51.83 | Payments for whole-farm conservation | Ranked applications |
| — Conservation Reserve Program | 20.00 | Rental payments to retire land | Continuous and general sign-up |
| — Conservation Operations | 15.11 | NRCS technical assistance and staff | Agency operations |
| — Agricultural Conservation Easement Program | 6.93 | Easement purchase | Ranked applications |
| — Chesapeake Bay Watershed Program | 3.34 | The dedicated Bay line, successor to the 2008 Farm Bill's $438M initiative | Targeted watersheds |
| EPA | 182.75 | Bay Program plus Bay shares of SRF and grant programmes | Formula, competitive, and revolving loan |
| — Chesapeake Bay Program line | 92.00 | Coordination, modelling, monitoring, grants | See Section III |
| — Clean Water SRF, Bay share | 62.59 | Loans for treatment plants and stormwater | State priority list, then loan |
| — §106 water pollution control, Bay share | 11.16 | State programme operations | Formula to states |
| — §319 nonpoint source, Bay share | 8.70 | Nonpoint programmes | Formula to states, then subgrant |
| Defense (non-Corps) | 51.58 | Installation compliance and restoration | Military construction and O&M |
| Interior | 47.66 | FWS refuges and Chesapeake WILD; USGS monitoring; NPS Gateways | Agency operations plus competitive grants via NFWF |
| Commerce / NOAA | 23.43 | Habitat, Sea Grant, B-WET education, coastal science | Competitive grants and agency science |
| Army Corps | 14.80 | Construction — chiefly oyster reef | Federal construction contracts |
| Homeland Security | 4.84 | Coast Guard and related | Agency operations |
| Total, regular appropriations | 591.05 | Plus $247.80M of infrastructure-law money = $838.85M | |
Source: 2024 Chesapeake Bay Crosscut Report. The Crosscut's Forest Service line does not reconcile with its own USDA subtotal and is omitted here rather than guessed at; see Section XIII. The 2008 Farm Bill's Chesapeake Bay Watershed Initiative was $438 million over ten years, about $43.8 million a year; its successor line is now $3.3 million, meaning USDA's Bay money is no longer Bay-specific in any programmatic sense.
IIIHow EPA splits its own money
Of the $92 million, about two-thirds leaves the building. In FY2024: $42.4 million in non-competitive implementation grants to the seven signatory jurisdictions under section 117(e) of the Clean Water Act; $9.1 million in Small Watershed Grants and $8.7 million in Innovative Nutrient and Sediment Reduction grants, both administered by the National Fish and Wildlife Foundation; $8.0 million directed to "Most Effective Basins." The remaining $29.6 million runs the Program Office — the model, the monitoring network, the partnership machinery that produces the numbers Study VI is built on.
Where the $92 million goes
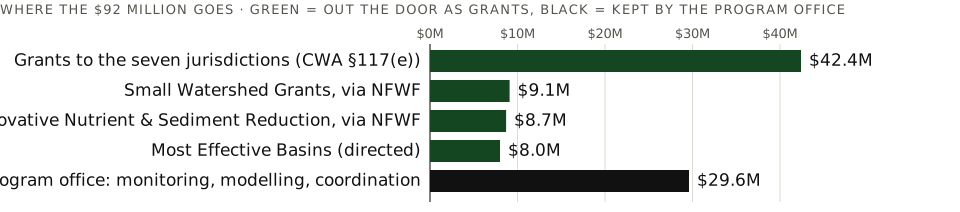
What it shows. The FY2024 decomposition. EPA announced in 2026 that it had raised implementation grants to more than $57 million and jurisdiction grants to $39.5 million, "redirected from coordination activities to field-tested projects" — a deliberate shift of the split shown here.
Sources. ChesapeakeProgress, Funding; EPA, increased annual funding. The Crosscut reports the same money on a budget-authority basis with Small Watershed and Innovative grants at a flat $10 million each; the difference is planned versus awarded. Data: ex04-epa-buckets.csv.
The allocation rule inside the largest bucket is the single most consequential structural fact in federal Bay funding, and it is published. Under EPA's 2025 grant guidance, 75 percent of implementation money is distributed by a fixed base: 20 percent each to Maryland, Pennsylvania and Virginia, 10 percent each to Delaware, New York, West Virginia and the District. Only the remaining 25 percent is weighted by water-quality performance, and even that carries an approximate 3 percent floor. Every grant requires a one-to-one non-federal match.
Three-quarters of the money is allocated by a split that does not move when the pollution does.
The formula: 75 percent fixed, 25 percent earned
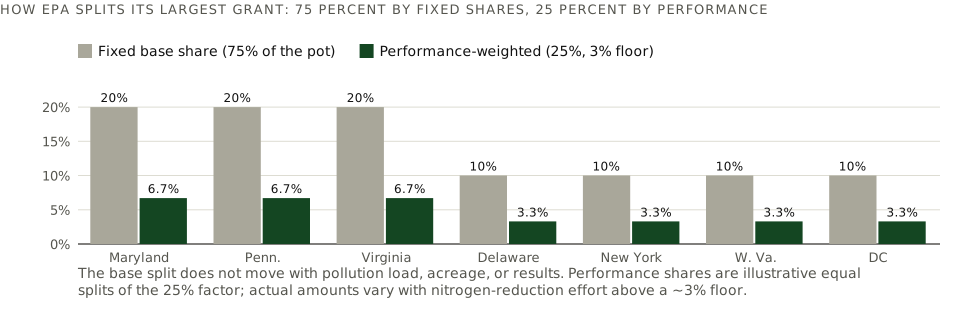
What it shows. The base shares that govern three-quarters of EPA's implementation grants, against the performance-weighted quarter. The same 20/20/20/10/10/10/10 split has been EPA's default whenever a new pot appears, including the 2021 environmental-justice tranche.
Sources. EPA, 2025 CBPO Grant Guidance, which sets out the Signatory Implementation Grant formula and the 50 percent cost share under CWA §117(e)(4)–(5). Data: ex05-formula.csv.
EPA does run one genuinely performance-allocated pot, and its history is instructive. The "Most Effective Basins" analysis scored state-river segments on how efficiently a pound removed there reaches tidal water and improves oxygen where it matters. The result put 24 of the top 29 basins in Pennsylvania. The first allocation, in 2020, followed the science: Pennsylvania took 61.6 percent. By the 2022 infrastructure-law round, a 40 percent set-aside for overburdened communities had been layered on, and Pennsylvania's share fell to 37 percent. Both objectives are defensible. The point is that the region has one instrument capable of directing money at cost-effectiveness, and it has been used at full strength once.
The performance pot, before and after the equity overlay
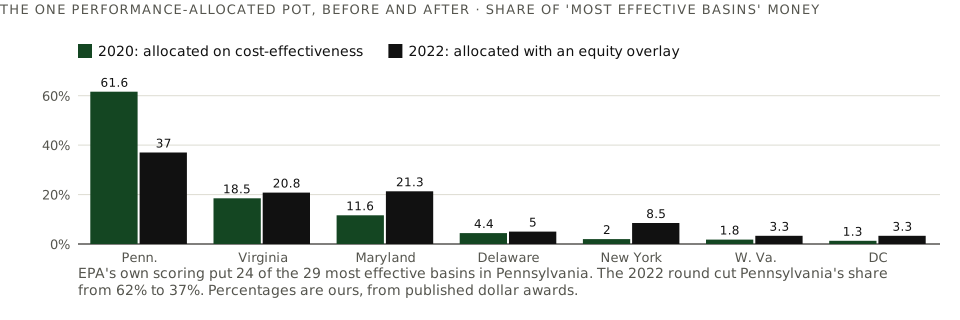
What it shows. Each jurisdiction's share of "Most Effective Basins" money in the 2020 effectiveness-based allocation and in the 2022 infrastructure round. Percentages are our arithmetic on the published dollar awards.
Sources. EPA, Most Effective Basins funding allocations rationale (2021 update), which also carries the $24 / $354 / $2,259 per-pound sector costs used throughout Study VI; EPA 2021 award release; EPA 2022 infrastructure release. Data: ex06-meb.csv.
IVThe flat line and the volatile money
Congress has protected the Bay Program line through two hostile budget cycles. It appropriated $93 million for FY2026 against a $92 million request, and the FY2027 request trims the line only 1.3 percent inside a proposed 52 percent cut to EPA overall — while zeroing San Francisco Bay entirely. Measured by the headline, Bay funding is the most stable environmental appropriation in the country.
Measured by what actually pays for construction, it is not stable at all. The Bay-attributed share of the Clean Water State Revolving Fund — the money that built the treatment plants — ran at $88.7 million in FY2022, $62.6 million in FY2024, and zero in the FY2025 request. The Army Corps line fell by three-quarters in a year. Infrastructure money fell from $298 million to $49 million. And the FY2027 request would cut the national revolving fund by about 90 percent, to $155 million, on an explicit rationale of "aligning the responsibility of infrastructure funding to the states."
What is protected and what is not
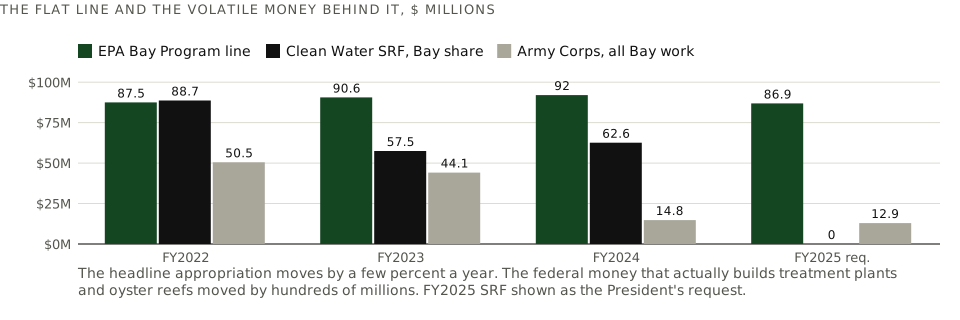
What it shows. The visible Bay Program appropriation against two invisible federal streams that do far more construction. Note also that EPA's own FY2027 justification reports FY2025 actuals of $86.9 million against an appropriation of about $92 million — a roughly $5 million gap the document does not explain.
Sources. EPA FY2027 Congressional Justification; 2024 Crosscut; EPA FY2027 Budget in Brief. Data: ex09-visible-invisible.csv.
Allocated is not spent: the infrastructure-law lag
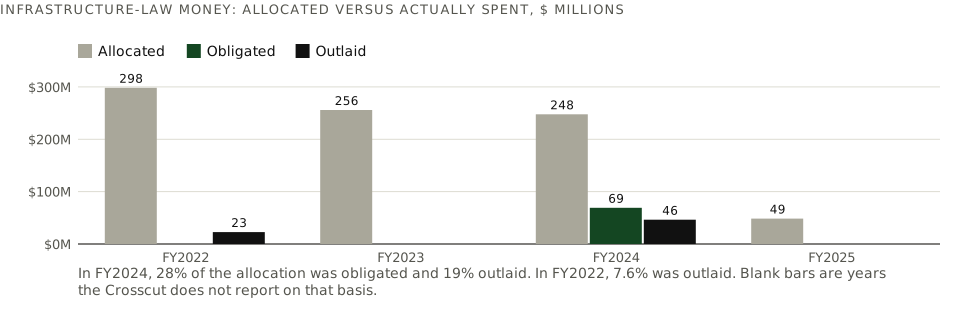
What it shows. Infrastructure-law money in the watershed, as allocated and as actually obligated and outlaid. The gap is not a scandal — large capital grants take years to move — but it means that headline announcements of infrastructure spending describe intent, and that the spend-down is still ahead of the region rather than behind it.
Sources. 2024 Crosscut, Table 1. Data: ex07-iija.csv.
Authorised versus appropriated
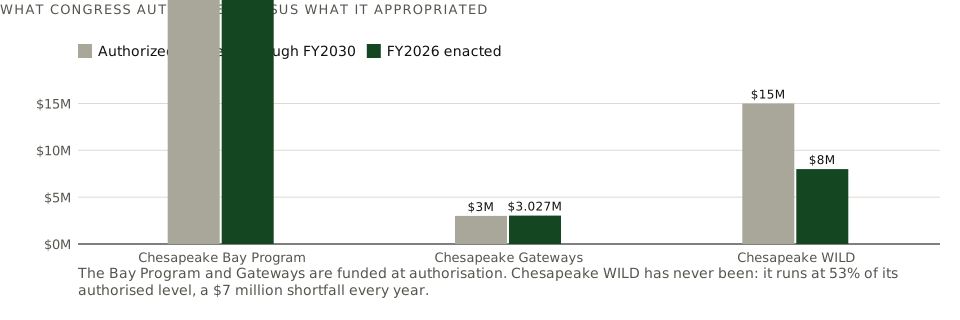
What it shows. The America's Conservation Enhancement Reauthorization Act, signed in 2025, authorises these programmes through FY2030. Two are funded at authorisation. Chesapeake WILD — the Fish and Wildlife Service's watershed grant programme — has never been, running at 53 percent of its authorised level.
Sources. CBF on the reauthorisation; FY2026 enacted detail; FWS 2026 WILD awards. Data: ex08-authorization.csv.
VThree state machines
The states put up about $1.45 billion of the $2 billion, and they raise and spend it in three fundamentally different ways. Maryland taxes ratepayers directly and bonds against the proceeds. Virginia funds from general-fund surplus under a statutory sharing rule and pays it out as reimbursement. Pennsylvania has no dedicated Bay revenue and runs on a landfill tipping fee, a one-time federal windfall, and federal pass-through.
Maryland: the dedicated fee
The Bay Restoration Fund — the flush tax — charges $5 a month per household on sewer and $60 a year per septic system, and has collected $2.19 billion since 2004. It is the clearest example in the country of hypothecated environmental revenue: the money arrives automatically, the State bonds against it, and the bonds built the enhanced nutrient removal upgrades that Study VI shows delivered two-thirds of all Bay nitrogen reductions. Sixty-six of 67 major plants are now upgraded. The fund's statutory authority changes on 1 July 2030, and its final bond payment falls in the same year.
The flush tax, 2004–2024: $2.19 billion in, and where it went
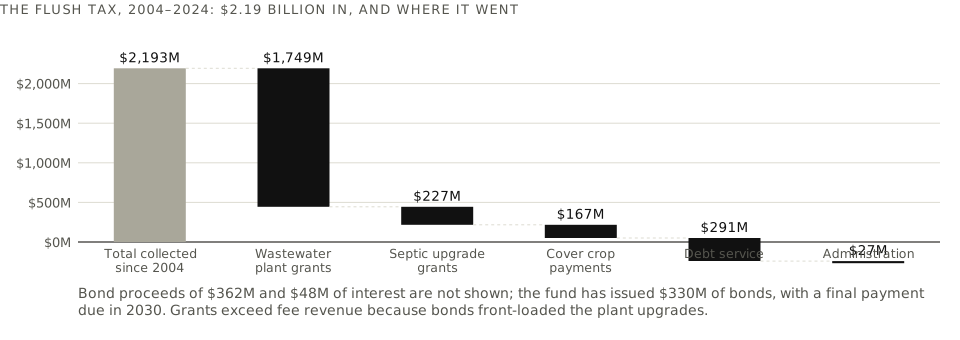
What it shows. Cumulative Bay Restoration Fund collections through 30 June 2024 against cumulative uses. Grants exceed fee revenue because $362 million of bond proceeds front-loaded the plant upgrades; $291 million of debt service is the price of that acceleration, and $27 million is administration.
Sources. MDE Bay Restoration Fund Advisory Committee report, January 2025; 21st annual report, January 2026; MD DLS 2026 Issue Papers for the bond position. Data: ex11-brf.csv.
Maryland's FY2027 Bay budget by category
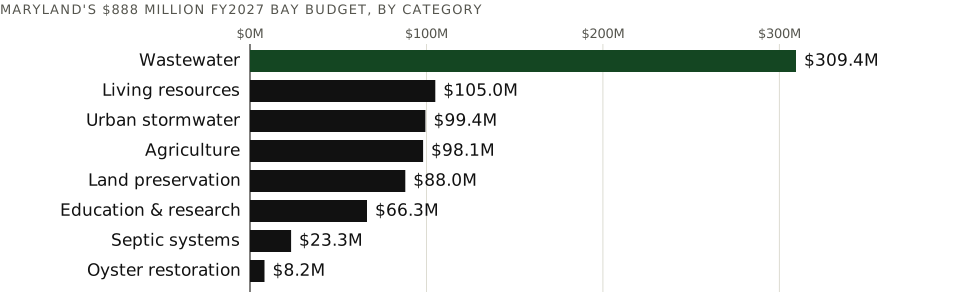
What it shows. The $888 million Governor's allowance. Wastewater still dominates, but increasingly as debt service and operating grants rather than construction: the build-out is finished. Note the caution in Section XIII — Maryland's Department of Legislative Services narrowed its own definition between the FY2026 and FY2027 overviews, and charting the two series together produces a 40 percent cliff that did not happen.
Sources. MD DLS, Chesapeake Bay Overview FY2027. Data: ex10-md-category.csv.
Maryland's Trust Fund is being spent down
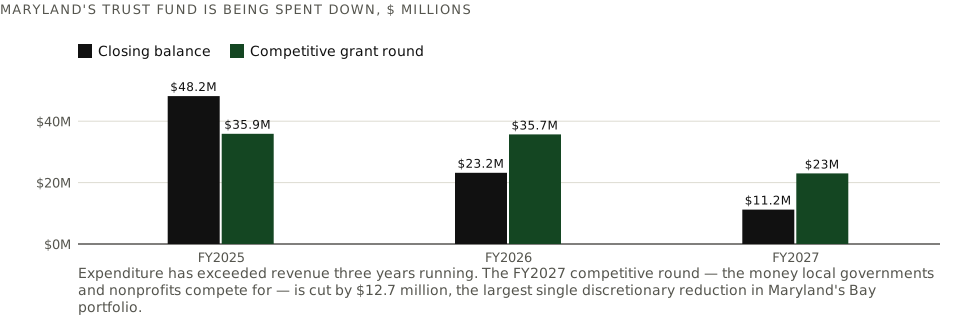
What it shows. The Chesapeake and Atlantic Coastal Bays Trust Fund — Maryland's dedicated nonpoint-source money, fed by motor fuel and short-term vehicle rental tax distributions — closing balance and competitive round. Expenditure has exceeded revenue three years running, and "cost containment swaps," which substitute Trust Fund special money for general funds elsewhere, rose from $2.6 million to $10.5 million.
Sources. MD DLS FY2027 Overview; DNR Trust Fund FY24–26 annual report. Data: ex12-trustfund.csv.
Virginia: reimbursement out of surplus
Virginia's Water Quality Improvement Fund is fed by a statutory share of good years: 10 percent of general fund revenue above the official estimate, plus 10 percent of any uncommitted year-end balance. There is no fixed split between point and nonpoint accounts; the Appropriation Act sets it annually. Since the 2021 Enhanced Nutrient Removal Certainty law, the fund has functioned less like a grant programme and more like a debt-service obligation: the 2026 session capped reimbursement to the Hampton Roads Sanitation District at $190 million a year from FY2026 through FY2031, with any unpaid amount deferred — an entitlement of up to $1.14 billion to a single utility.
Alongside that, Virginia runs the largest agricultural cost-share programme in the watershed: $223 million in FY2026 and a record $304 million in FY2027, allocated to 47 soil and water conservation districts by a published formula — 70 percent to the Bay watershed by statute, and within each basin 50 percent of the money to hydrologic units ranked high for nutrient and sediment load, 30 percent to medium, 20 percent to low, with a $300,000 cap per applicant. Its urban equivalent is $2 million.
Virginia's Bay money, and how lopsided it is
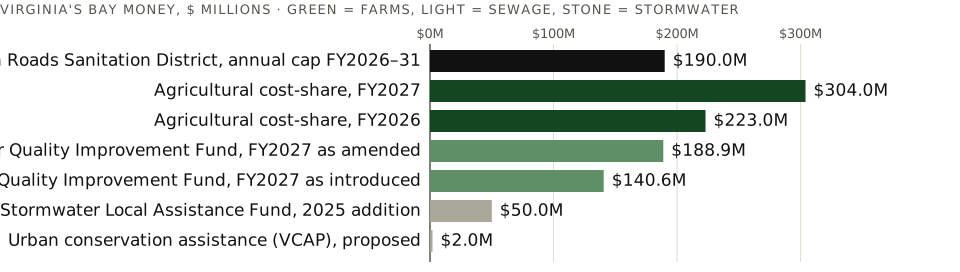
What it shows. Virginia's principal Bay lines. One sanitation district's annual entitlement exceeds the entire stormwater assistance appropriation by nearly four to one, and exceeds urban conservation cost-share by ninety-five to one.
Sources. Va. Code §10.1-2128; Item 368 #4h (WQIF); Item 365 #6h (HRSD cap); DCR VACS overview; FY26 cost-share policy; Item 365 #2h (SLAF). Data: ex14-virginia.csv.
Pennsylvania: the state that publishes its own shortfall
Pennsylvania holds the largest nitrogen obligation in the watershed and the least money. Its Department of Environmental Protection states on a public webpage that the investment needed is about $521 million a year against roughly $197 million available — a $324 million annual gap. It is the only Bay jurisdiction that publishes that arithmetic about itself.
What it does have is a recurring $50 million Clean Streams Fund, 71.5 percent of which goes to the Agricultural Conservation Assistance Program and is allocated to all 67 counties by a formula of farms, livestock operations and impaired stream miles — then awarded to individual farmers by county conservation districts. That is the most decentralised award structure of the three states: 67 separate local processes. Its origin was one-time: $220 million of federal pandemic relief, of which $154 million went to the programme, with a hard requirement to commit by the end of 2024 and spend by the end of 2026.
Pennsylvania: the gap, and the fund that does not close it

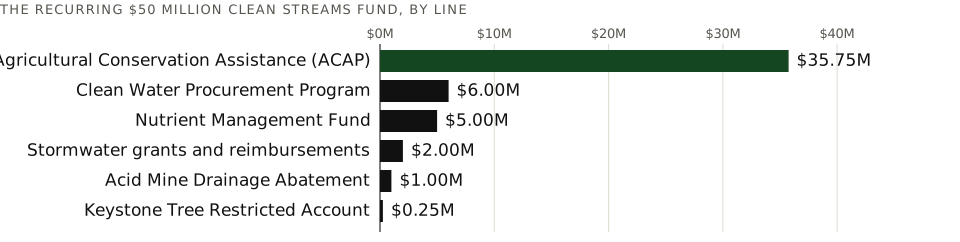
What it shows. Top: Pennsylvania's own published need, spend and shortfall. Bottom: the recurring Clean Streams Fund by line. The fund is 15 percent of the gap.
Sources. PA DEP, WIP and CAP background; CBF on the enacted budget (an advocacy source for the line-item split; the underlying appropriation is a state budget document we did not retrieve). Data: ex15-pa.csv.
The federal half of Pennsylvania's county grants just halved
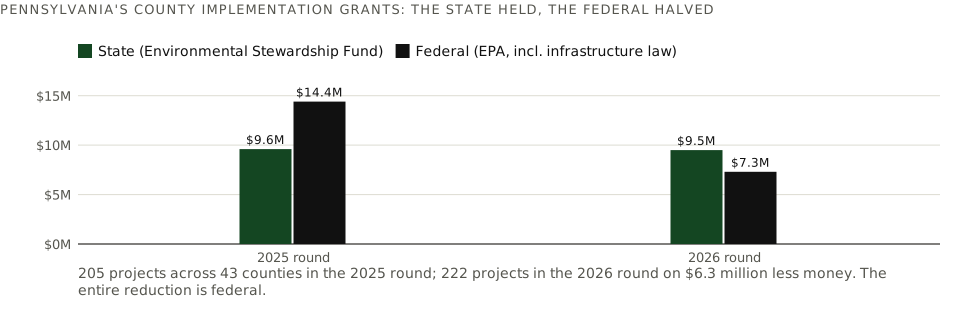
What it shows. Pennsylvania's Countywide Action Plan implementation grants in two successive rounds. State money held almost exactly flat; federal money fell from $14.4 million to $7.3 million. The state delivered more projects on less money, which is what a squeeze looks like before it becomes a cut.
Sources. PA DEP, 10 Dec 2024; PA DEP, 12 Dec 2025. Data: ex16-pa-cap.csv.
VIHow a dollar becomes a project
The chain from an appropriation to a crew on a stream bank has a fixed number of links, each of which takes a share and imposes a rule.
- Congress appropriates. The Bay Program line, or a Farm Bill programme, or a capitalisation grant for the state revolving fund.
- EPA awards a grant to the jurisdiction under CWA §117(e), with a one-to-one non-federal match — every federal dollar must be met by a state or local dollar before it can be spent.
- The state passes it through. Sub-awards are governed by 2 CFR 200: the pass-through must supply a defined data set, assess each subrecipient's fraud and compliance risk, and monitor performance. A recipient without a negotiated indirect rate may charge up to a 15 percent de minimis rate; state programmes often cap administration at 10 percent of the award.
- The local government, nonprofit or farmer receives it — as a competitive grant, a formula cost-share, or a loan.
- A design consultant is procured, typically under a professional-services or on-call contract.
- A construction contractor is procured, under design-bid-build, design-build, or a full-delivery contract that bundles the two and pays on results.
- Subcontractors do most of the work, subject to participation goals: Maryland's statewide minority business enterprise goal is 29 percent; Baltimore County sets an overall 15 percent MBE/WBE goal; the District requires 35 percent subcontracting to small business enterprises on contracts over $250,000.
The rules that decide how much of a grant reaches the ground
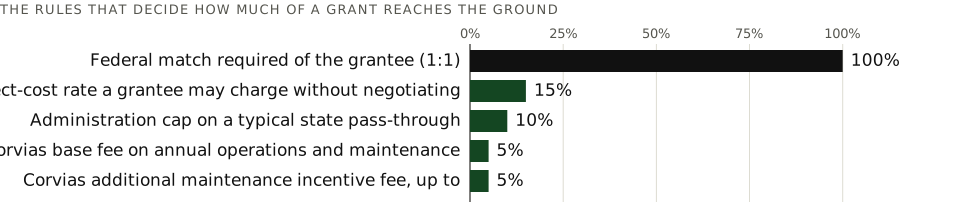
What it shows. The match, overhead and fee rules along the chain. The one-to-one match is the largest single lever in the system: it doubles the effect of every federal Bay dollar, and it also means a jurisdiction that cannot raise its half leaves federal money unclaimed.
Sources. MD DNR on the CBIG 1:1 match; Delaware DNREC FY26 CBIG RFP (10 percent administration cap); 2 CFR 200.414(f); 2 CFR 200.332; UNC Environmental Finance Center case study for the partnership fees. Data: ex18-overhead.csv.
The four mechanisms, and how big each is
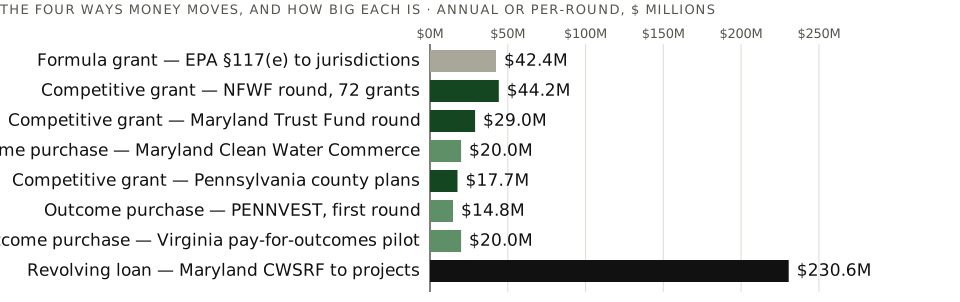
What it shows. Annual or per-round size of the four ways money moves. The revolving loan is an order of magnitude larger than anything else and is the least discussed; the outcome purchase is the smallest and the most discussed. Maryland's revolving fund had $248 million available in one year, of which $231 million went to projects, at 50 percent of market interest (25 percent for disadvantaged communities), with principal forgiveness up to half the financed amount capped at $1.5 million, and a 10 percent green-project reserve.
Sources. MDE FFY2025 CWSRF Intended Use Plan; NFWF, February 2026; MD DNR Trust Fund round; PA DEP; PENNVEST. Data: ex17-mechanisms.csv.
A note on who wins competitive grants, because it shapes the whole nonprofit economy of the region. The February 2026 NFWF round awarded $44.2 million across 72 grants — a mean of about $614,000 — leveraging $31 million of match. Small Watershed Grants run $150,000 to $750,000 for implementation and up to $150,000 for planning; the innovative-reduction grants go up to $1 million. Match is "encouraged, but not required," and volunteer hours count. Eligible applicants include businesses, but the winners are overwhelmingly land trusts, watershed associations, conservancies and universities. That is the pipeline through which a very large share of the region's on-the-ground restoration is actually commissioned.
VIIBuying the outcome
Four programmes in the region have stopped buying assets and started buying results. They are small, they are the most interesting thing happening in Bay finance, and their prices are wildly inconsistent.
Maryland's Clean Water Commerce Act transfers $20 million a year out of the flush tax to buy verified reductions. The statute permits purchase only of outcomes with an expected life of at least ten years, and sets sector minimums — at least 35 percent agriculture, at least 20 percent in environmental-justice communities, at least 10 percent non-agricultural landscape restoration. Bids are scored out of 100: 60 points for cost-effectiveness, 40 for co-benefits, with the cost points awarded by rank rather than absolute price — lowest price takes 60, second 45, third 30, fourth 15, everyone else zero. Contracts run up to 20 years. The FY2024–25 round drew 22 applications requesting $77 million against roughly $47 million available.
Pennsylvania's Clean Water Procurement Program, created by Act 54 of 2022, scores 60 points technical and 40 cost, requires a DEP-approved verification plan before bidding, and has run three rounds of descending size: $14.8 million, $7.1 million, $4.2 million.
Virginia put $20 million into a one-year pay-for-outcomes pilot in the 2024 budget, paying farmers on pounds actually removed. Anne Arundel County runs the model at county scale: private firms find the site, front the construction cost, and are reimbursed only after the county verifies the credits, with maintenance payments released annually for five years and bids ranked on cost per equivalent impervious acre.
And DC Water's Environmental Impact Bond — $25 million, placed privately with Goldman Sachs and Calvert Impact Capital — is the purest risk-transfer instrument the sector has tried: if green infrastructure on 365 acres reduced runoff by less than 18.6 percent, investors would pay the utility $3.3 million; above 41.3 percent, the utility would pay investors $3.3 million. Performance landed at about 20 percent, inside the band. No payment moved in either direction. The much-praised risk transfer was never actually tested.
What a purchased pound of nitrogen costs
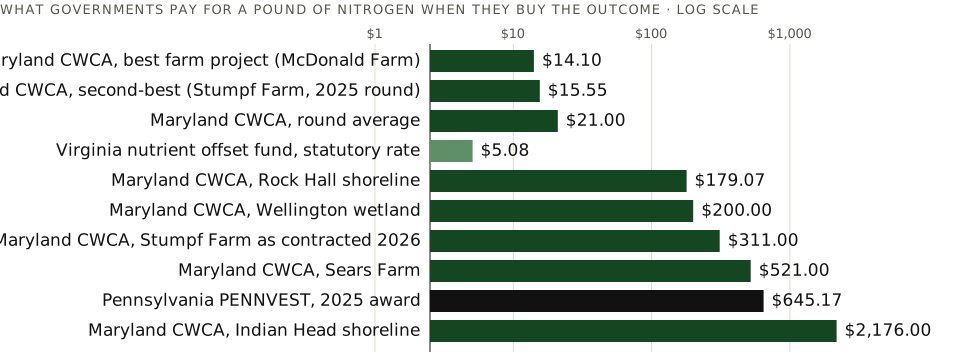
What it shows. Prices from actual outcome purchases, log scale. The spread inside a single Maryland programme runs from $14 to $2,176 a pound. A caution on comparability: the 2026 Maryland figures divide a whole contract by one year's pounds, and those contracts may run up to 20 years, so they are not directly comparable to the 2025 round's per-pound figures — which is itself a finding about how hard these programmes are to evaluate from public documents.
Sources. MDE CWCA FY24–25 selections; MDE, 20 May 2026; Va. Code §10.1-2128.2; PENNVEST, August 2025. Data: ex19-outcome-prices.csv.
VIIIThe credit markets
Underneath the government purchases sits a set of private markets in which a permittee buys compliance from someone else. Each jurisdiction runs its own, with its own discount factors, and none of them publishes a market price.
The discounts are the substance. Pennsylvania withholds a 10 percent reserve and applies a 3:1 uncertainty ratio to nonpoint credits — three pounds reduced for one pound sold. Maryland withholds 5 percent and applies 2:1 for nonpoint-to-wastewater trades, with verification at least every three years and a public registry giving every credit a registration number. Virginia applies 2:1, reducible with direct measurement or permanent land protection. Delaware, New York and West Virginia have no comparable programme at all.
The volumes tell you how thin these markets are. Maryland had certified nine trades between 2018 and 2021. Pennsylvania's own auction programme ran from 2010 to 2018 and was discontinued for lack of use. Virginia's exchange — 70-odd owners of about 105 treatment facilities — reports full compliance every year, but EPA's case study notes the structural weakness: when supply far exceeds demand, prices collapse and members trade bilaterally outside the exchange.
The two discounts that stand between a practice and a sellable credit
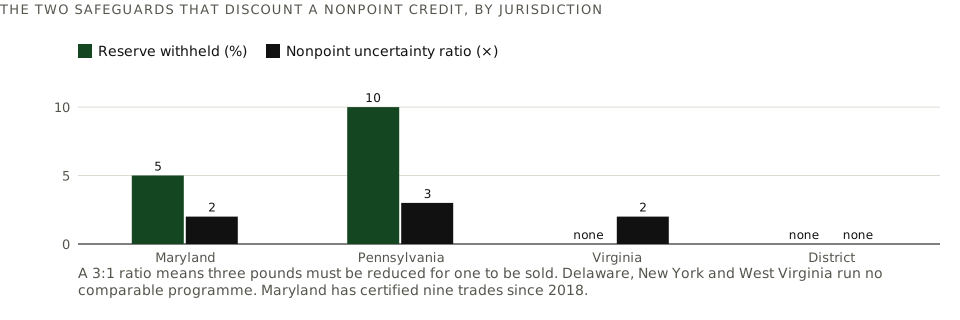
What it shows. The reserve withheld by the regulator and the uncertainty ratio applied to nonpoint credits, by jurisdiction. These are the safeguards that make a traded pound worth less than a modelled pound — and the reason a farm practice that costs $16 a pound to install may sell for several times that.
Sources. EPA, 2021 Chesapeake Bay trading and offsets summary; Maryland water quality trading regulations. Data: ex25-safeguards.csv.
The District runs the region's most transparent market by refusing to set a price and instead publishing both bounds. A Stormwater Retention Credit is one gallon of retention for one year. The ceiling is the in-lieu fee a developer may pay instead — $5.01 per gallon-year from August 2026, inflation-adjusted annually, set at the District's own cost of delivering that gallon. The floor is the Price Lock programme, which guarantees $2.03 for non-tidal and $1.77 for tidal credits in years one to six, dropping to $0.42 thereafter, backed by about $1.25 million a year. Between those bounds, more than 1.7 million credits have sold from 26 distinct sellers.
The District sets no price — it sets a ceiling and a floor

What it shows. The published bounds of the District's stormwater credit market, dollars per gallon-year. This is the design other jurisdictions should copy: it gives a generator a bankable floor and a buyer a known worst case, without the regulator pretending to know the clearing price.
Sources. DOEE in-lieu fee; DOEE SRC Price Lock; The Nature Conservancy, ten years of the SRC market. Data: ex20-src.csv.
The one fully public price list: Virginia's in-lieu fee per wetland credit
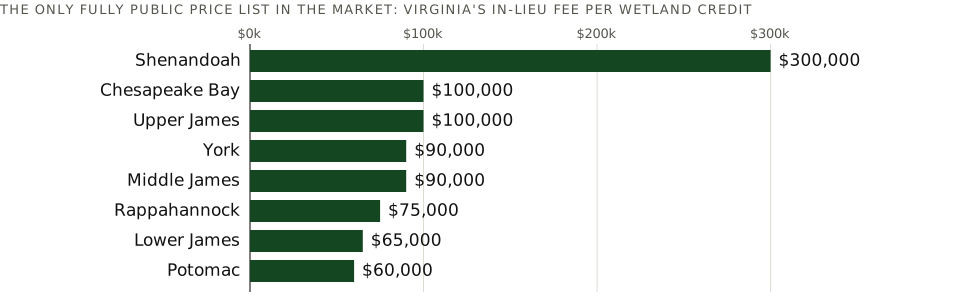
What it shows. The Virginia Aquatic Resources Trust Fund's January 2025 fee schedule — what a developer pays per wetland credit when no mitigation bank credit is available, by watershed. Stream credits in the same schedule run $400 to $1,800. Private bank prices, which are what most of the market actually pays, are not published anywhere; the commercial price series for this region costs $7,300.
Sources. VARTF fee schedule, January 2025 (administered by The Nature Conservancy with the Norfolk District and Virginia DEQ). Data: ex21-vartf.csv.
IXThe private vertical
Now the question that prompted this study: how a private, for-profit company buys or generates credits, becomes the prime contractor, and awards the work.
The full-delivery contract
The mechanism is simple and, on its face, excellent public policy. Instead of the county designing a project, bidding it, and hoping it performs, the county publishes a price it will pay for a verified outcome. A private firm finds the site, negotiates with the landowner, designs and builds the project with its own money, and is paid only when the county verifies the credits — with a portion held back over five years of maintenance. Anne Arundel County has run this since 2018, with awards from $363,000 to $3 million, ranked on cost per equivalent impervious acre. Its awardees have included BayLand Consultants & Designers, Underwood & Associates, Wildlands Engineering, Restoration Systems, and Resource Environmental Solutions.
The risk transfer is real, and so is the barrier to entry. Virginia's equivalent programme requires payment and performance bonds equal to the full cost of implementing the design, from a surety rated A− or better, and requires the contractor to find a third party willing to hold perpetual stewardship. That is a balance-sheet test, and it systematically favours private-equity-backed national firms over the local specialists who invented the techniques.
The programme manager
Prince George's County went further and hired a manager for the whole programme. Corvias — a firm whose original business was privatised military housing — holds a three-year master programme agreement and a thirty-year maintenance agreement. It does not build: CH2M Hill Constructors was the general contractor, Bowman Consulting and CH2M Hill the design engineers, Stormwater Maintenance LLC the maintenance prime, and Maryland Environmental Service the independent certifier. Corvias earns $1 million on execution, design fees at 30/60/90/100 percent milestones, a base fee calculated as a percentage of all project costs, a 5 percent base fee on annual operations and maintenance, and incentive fees of up to another 5 percent.
What it is scored on is unusual and worth reproducing exactly: 35 percent on impervious acres credited, 15 percent on schedule, 15 percent on the mentor–protégé programme, 10 percent on county-resident workforce, and 10 percent on local, small, minority and women-owned business participation. Hit 75 percent of the metrics and the second 2,000-acre tranche follows. The programme reports 428 sites, 4,658 completed credit acres, $329.6 million expended, and $257.2 million — 78 percent — to local and minority businesses.
What the private partner is actually scored on
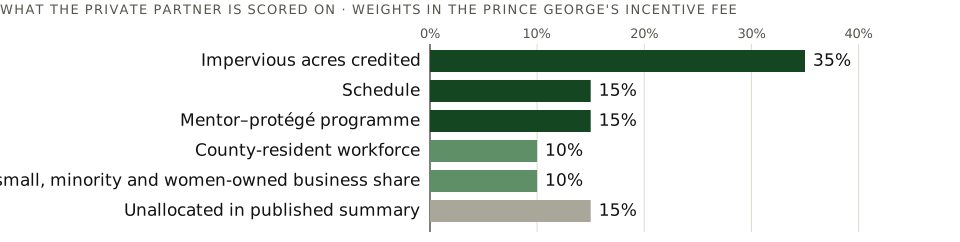
What it shows. The incentive-fee weights in the Prince George's community-based partnership. Half the scorecard is economic development rather than water quality — a deliberate and publicly stated policy choice, and one that should be named when the programme's cost per acre is compared with a conventional procurement's.
Sources. Prince George's County CBP3 programme document; UNC Environmental Finance Center case study; The Clean Water Partnership dashboard, March 2026. The unallocated 15 percent is the residual in the published summary. Data: ex22-scorecard.csv.
What an impervious acre costs under different delivery models

What it shows. Reported cost per impervious acre under a county full-delivery programme, under the Prince George's partnership, and on average across Maryland. The partnership's $70,760 is our arithmetic — $329.6 million expended divided by 4,658 credit acres — against the county's own pre-partnership estimate of $80,000, which is a saving of roughly 12 percent rather than the 30 percent projected. Anne Arundel's $8,662 is the county's own figure on a different basis and is not directly comparable; the gap between the two is large enough that it should be reconciled before either is used to price work.
Sources. Anne Arundel FY2020 WPRP annual report; Clean Water Partnership dashboard; PG CBP3 document; MDE FAP report, October 2025. Data: ex24-cost-per-acre.csv.
The bankers who are also the builders
The firms that dominate this market are vertically integrated by design, and several say so in their own marketing. Resource Environmental Solutions — backed by KKR since 2017 and Onex since 2022 — calls itself the country's largest ecological restoration company and sells "full delivery, long-term stewardship, and guaranteed performance." It entered Maryland by acquiring Environmental Banc & Exchange in 2014 and the Virginia–Maryland builder Angler Environmental in 2016, and lists work for the State Highway Administration and six Maryland counties. Ecosystem Investment Partners has raised nearly $1.5 billion across five institutional funds, the latest closing at over $400 million in October 2025, and describes its Cecil County work for Maryland DNR and SHA as a pay-for-performance package covering "land acquisition, restoration design, permitting, construction, financial assurances, monitoring and maintenance." Wildlands Engineering owns and operates more than 60 mitigation banks and reports over $200 million in turnkey and full-delivery contracts. Ecotone, of Forest Hill, Maryland, advertises mitigation credit inventory and design-build services in the same brochure — the model in its purest published form: bank the credit, design it, build it, monitor it.
Two facts about this market's governance deserve to sit next to each other. The founder of Wetland Studies and Solutions, one of the region's largest wetland consultancies and mitigation bankers, was appointed Director of the Virginia Department of Environmental Quality — the agency that certifies nutrient credits and co-administers the state's in-lieu fee. And a Maryland restoration contractor formally lobbied the General Assembly for a statutory definition of "ecological restoration" and a separate, faster permitting track for the projects it sells.
Pennsylvania's outcome purchase, and who won it
Which brings us to the finding that changes how the region's flagship pay-for-results programme should be read. Across three rounds, Pennsylvania's Clean Water Procurement Program has awarded roughly $28 million. One bidder, named in every announcement only as "HGS, LLC," took $22.6 million of it — 81 percent. The other named awardees were an engineering firm, a land trust and a conservancy.
HGS, LLC is not an unknown local operator. Florida's engineering business registry lists "HGS, LLC" as the primary licensee name with the trade name "RES Environmental Operating Company," at 6675 E Pine Street, Bellaire, Texas — the corporate address of Resource Environmental Solutions. A federal contracting database indexes the same vendor as "HGS LLC (Angler Environmental, a RES company)." We could not locate a Pennsylvania fictitious-name filing making the link on the Commonwealth's own records, so we present the identification with its evidence rather than as a settled corporate fact; but on the face of the public licensing record, the great majority of Pennsylvania's pay-for-results money has gone to the Chesapeake arm of a KKR- and Onex-backed national firm, under a name that does not obviously connect to it.
A programme designed to discover the cheapest pound in Pennsylvania has, so far, mostly discovered one company.
Pennsylvania's outcome purchase, and who won it
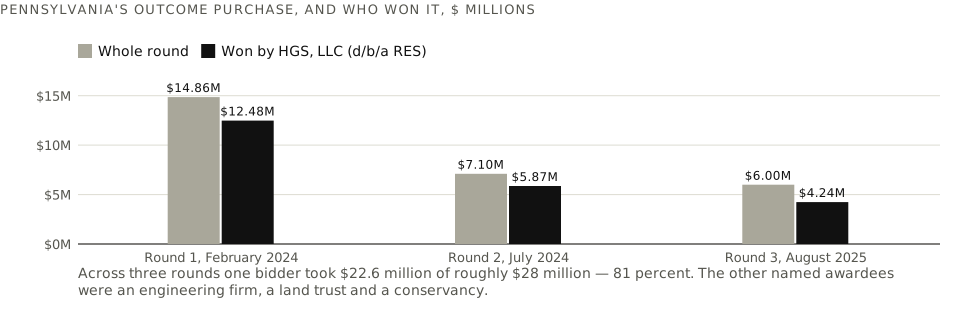
What it shows. Each PENNVEST Clean Water Procurement round and the share taken by HGS, LLC. The August 2025 award priced nitrogen at $645.17 a pound over a 20-year term — well above what Maryland's parallel programme pays for farm practices, and above EPA's own average for urban stormwater practices.
Sources. PENNVEST award announcements: February 2024, July 2024, August 2025. Identification of HGS, LLC: Florida DBPR engineering business registry, licence 35185. Data: ex23-pennvest.csv.
Where the safeguards are thin
None of this is unlawful, and most of it is the predictable result of asking private capital to carry construction and performance risk. But four weaknesses are documented in the public record and should be named.
First, verification sits close to the seller. In the full-delivery model the county verifies, which is sound. In credit generation the seller produces the verified reductions under an approved plan. Where a single firm banks, designs, builds and monitors, the only independent check is a state certification that, in Maryland's case, has been applied to nine trades since 2018.
Second, financial assurance is rarely tested. Bonds, letters of credit and escrow are required and are held by a party acceptable to the Corps rather than by the Corps, and are phased out as milestones are met. EPA's own fact sheet notes that few claims have ever been made on them.
Third, long-term liability is designed to be handed off. Virginia's in-lieu fund explicitly declines to hold the easement or act as long-term steward; the contractor must find someone who will, in perpetuity.
Fourth, the product itself is contested. The Bay Program's own science committee found in 2024 that significant biological uplift from stream restoration is rare. Testimony filed with the Maryland General Assembly lists failed restorations by name, including one requiring $3.6 million in repairs. The Center for Progressive Reform argues Maryland's trading rules award credits for reductions taxpayers already bought through the flush tax. None of that is an argument against paying for outcomes; it is an argument for measuring them.
XThe calendar and the money
Two views of the same thing. The first is the schedule: when each fund, permit, authorisation and deadline starts and stops. The second is the same calendar with the dollars attached, so that the cliffs are visible.
Every obligation and every funding stream, 2022–2040
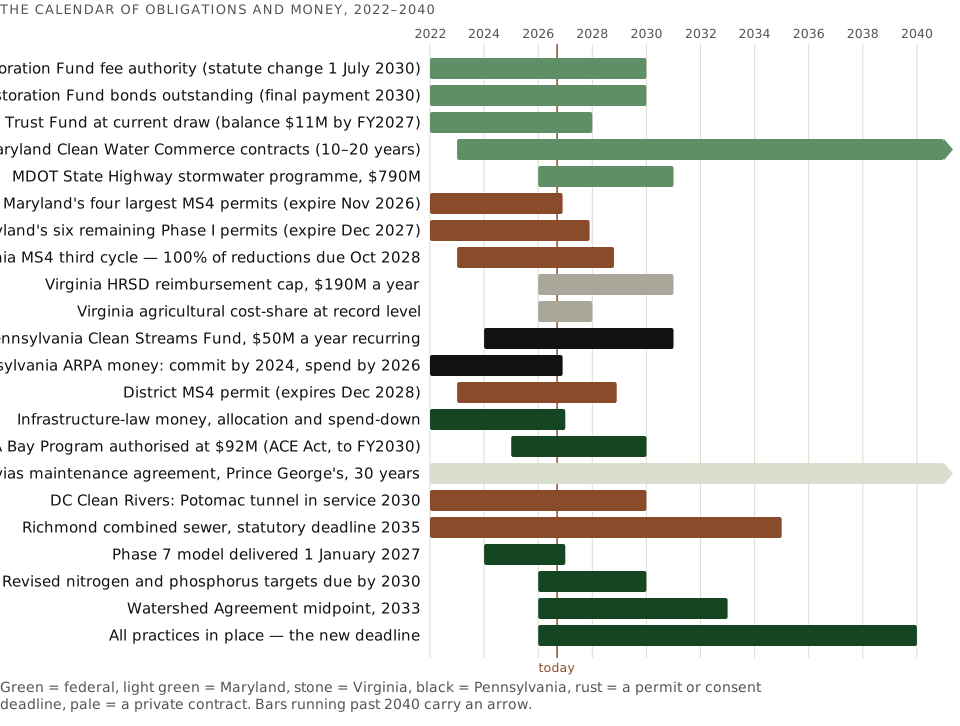
What it shows. A Gantt of the region's money and its deadlines. Read the cluster at 2026–2031: Maryland's four largest stormwater permits expire in November 2026 and its remaining six in December 2027; Pennsylvania's pandemic money had to be spent by the end of 2026; Virginia's 100 percent stormwater deadline is October 2028 and the District's permit expires that December; Maryland's flush-tax statute changes and its bonds retire in 2030, the same year the Potomac tunnel opens and revised Bay targets are due; Virginia's utility cap ends in 2031. Almost every financing instrument in the region resets inside five years, and the restoration deadline sits nine years beyond that.
Sources. As cited throughout; permit dates from MDE, 9VAC25-890-40 and DOEE; deadline structure from the revised Chesapeake Watershed Agreement, 2 December 2025. Data: ex26-gantt.csv.
The same calendar, as money
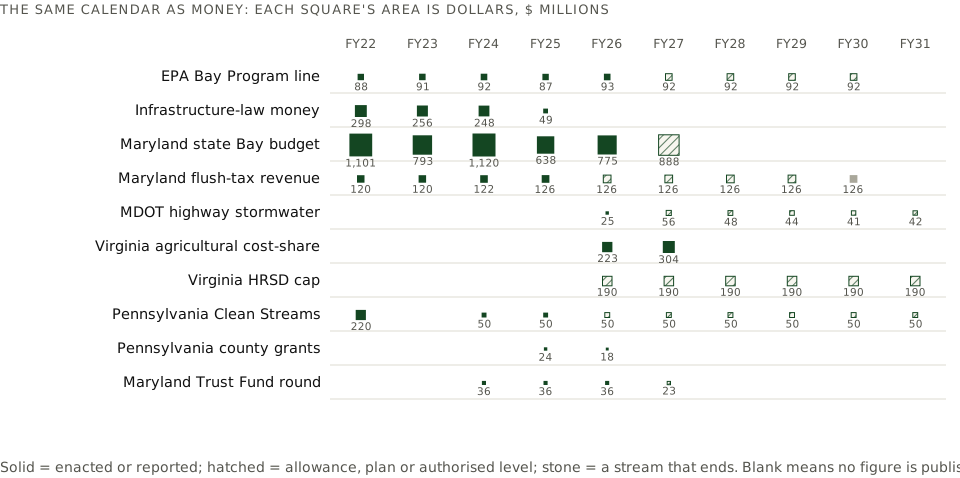
What it shows. The second view: each square's area is dollars, so a funding cliff is a row that shrinks or stops. The infrastructure row simply ends. Maryland's Trust Fund round contracts. The State Highway programme grows just as the county permits it serves come up for renewal. Solid squares are enacted or reported figures; hatched squares are allowances, plans or authorised levels; stone squares mark a stream that terminates. A blank cell means no figure is published on that basis for that year — not zero.
Sources. As cited in the relevant sections above. Data: ex27-money-time.csv.
XIWhat comes next
Three things can be said about future spending with reasonable confidence, and one cannot.
The federal headline will hold and the federal substance will shrink. The America's Conservation Enhancement Reauthorization Act authorises $92 million a year for the Bay Program through FY2030, and Congress has appropriated at or above that in each of the last two cycles against hostile requests. But the FY2027 request would cut the Clean Water State Revolving Fund by roughly 90 percent on an explicit federalism rationale. If that survives even partially, the states lose the cheapest construction capital they have, and the loss will not appear in any "Chesapeake Bay funding" headline.
State money is committed years out, and unevenly. Virginia has forward-committed up to $1.14 billion to one utility through 2031 and put agricultural cost-share at a record $304 million. Maryland has $790 million programmed for highway stormwater across FY2026–31 and a Trust Fund whose balance falls to $11 million. Pennsylvania has $50 million a year against a $324 million gap. Nobody has published a cost to reach the 2040 targets.
The private vertical will consolidate. Bonding requirements, perpetual stewardship obligations and multi-decade maintenance agreements are balance-sheet tests. They are met most easily by firms with institutional capital behind them, which is why a Texas company with private-equity ownership won 81 percent of Pennsylvania's outcome money and appears on Anne Arundel's bidder list, in Prince George's as a subcontractor, and on Maryland SHA's rolls. If the region wants a competitive market of local specialists, it will have to design for one deliberately — through smaller lots, shared surety facilities, or the mentor–protégé structures Prince George's already scores its partner on.
What cannot be said is what any of it buys. No jurisdiction has published a cost to reach the 2040 targets, and the one instrument that prices outcomes directly returns numbers a hundredfold apart for the same pollutant in the same programme.
XIIWhat we would do
- Publish one number, four ways, every year. The region cannot argue about funding while four defensible totals are in circulation. Whoever publishes the Crosscut should publish a single reconciliation table — programme line, all-agency appropriation, capital finance, and infrastructure money — and label every column enacted, actual or requested.
- Move the formula. Seventy-five percent of EPA's implementation grant is allocated on a split unchanged by evidence. EPA's own Most Effective Basins work shows it knows how to target. Shifting the base-to-performance ratio from 75/25 toward 50/50 over three cycles would redirect roughly $10 million a year toward the basins that hold the remaining load, without a new appropriation.
- Defend the revolving fund, not just the line item. The advocacy energy spent protecting a $93 million appropriation should be spent at least equally on the state revolving fund, which delivered more Bay construction than the Bay Program ever has and is the actual target of the FY2027 request.
- Buy outcomes, but publish the unit price every time. Maryland, Pennsylvania and Virginia should each publish, for every outcome contract: dollars, pounds, contract years, dollars per pound-year, and the verification method. Today a reader cannot tell whether a $8.4 million purchase is a bargain or ten times the going rate, because the pounds and the term are reported inconsistently.
- Disclose beneficial ownership in outcome procurements. A state buying results from "HGS, LLC" should say on the award notice who that is. This costs nothing, is standard in other procurement regimes, and would let the public see concentration as it happens rather than two years later.
- Separate the seller from the verifier, in writing. Where a firm banks, builds and monitors, require independent third-party verification paid for by the buyer, not the seller — the model Prince George's already uses with an independent completion certifier.
- Design for a local market. Bonding and perpetual-stewardship requirements are sound risk management and a structural barrier to the regional specialists who invented these techniques. Smaller contract lots, a shared surety facility, and stewardship held by a public land trust would keep more of the money in the watershed that generates it.
A note on our interest, as in Study VI. This firm's principal works in the stormwater and landscape construction trade in the Maryland–Virginia–District market, which is to say inside the last link of the chain this study describes. We have written the numbers as the sources give them, including the ones that are uncomfortable for the trade.
XIIIWhat we could not verify
Sought and either not found in a primary source, found only in secondary coverage, or found in a form we could not read. None is used as a load-bearing figure.
- A Pennsylvania corporate filing linking HGS, LLC to RES. The identification rests on Florida's engineering business registry (licence 35185, primary name HGS, LLC, trade name RES Environmental Operating Company, at RES's Bellaire, Texas address) and a federal contracting index. We did not confirm whether PENNVEST's evaluators knew, and we make no claim that anything improper occurred.
- The Crosscut's Forest Service line, which does not reconcile with its own USDA subtotal; and per-state NRCS obligation totals for the watershed portions of Maryland, Virginia and Pennsylvania.
- Why FY2024 implementation grants to the District and West Virginia appear at about $0.09 million each when the published formula implies roughly $4.2 million; and the current status and dollar value of the Chesapeake Bay Regulatory and Accountability Program, which appears on Bay Program pages but not in the 2025 grant guidance.
- The reconciliation of EPA's FY2025 Bay Program actuals ($86.9 million) with the appropriated level (about $92 million).
- The composition of the FY2022 infrastructure tranche, whose published categories sum to $47.8 million against a $40 million headline.
- The disposition of Inflation Reduction Act conservation money in the watershed after 2025; the relevant Congressional Research Service products are blocked to automated retrieval.
- Corvias's base fee percentage on construction and programme costs — only the 5 percent operations-and-maintenance base fee and up to 5 percent incentive are disclosed — and any genuinely independent audit of the partnership. The most cited evaluation is a Harvard Extension School capstone announced through the partnership's own press channel.
- Whether Anne Arundel's $8,662 per impervious acre and Prince George's $70,760 are computed on comparable bases; the gap is an order of magnitude and neither county publishes a reconciliation.
- Actual proposal counts, as opposed to registered plan holders, on county full-delivery solicitations; contractor margins on full-delivery work, which appear nowhere in the public record.
- Private mitigation bank credit prices anywhere in Maryland, Virginia or Pennsylvania; the commercial price series is paywalled. Pennsylvania publishes credit volumes and parties by design but no prices at all.
- Virginia's Water Quality Improvement Fund year-by-year deposit history and point/nonpoint split; the statewide total cost of its Enhanced Nutrient Removal Certainty programme; the Stormwater Local Assistance Fund's cumulative awards; and the Virginia Clean Water Revolving Loan Fund's annual capitalisation and terms.
- Pennsylvania's per-county ACAP allocation table and cost-share caps; the enacted rather than proposed Clean Streams Fund figure; and whether the $521M/$197M/$324M gap figures have been updated since the Phase III plan.
- Maryland's Trust Fund revenue rates in statute; the internal allocation rules of the Bay Restoration Fund's wastewater account; county-by-county stormwater fee revenue; and the Clean Water Commerce Act's maximum price per pound, if any.
- Army Corps oyster-restoration cost shares per tributary; Chesapeake Bay Trust and Alliance for the Chesapeake Bay pass-through amounts from the Bay Program.
XIVSources
Federal appropriations and the crosscut. 2024 Chesapeake Bay Crosscut Report; 2022 edition; 2020 edition; 2019 edition; FY2014–17 edition. EPA FY2027 Congressional Justification, Environmental Programs and Management; EPA FY2027 Budget in Brief; FY2023 Congressional Justification. ChesapeakeProgress, Funding.
EPA grant structure. 2025 CBPO Grant Guidance (the §117(e) allocation formula, 75/25 split, 3 percent floor, 50 percent cost share); Most Effective Basins funding allocations rationale; EPA, $7.25M award (2021); EPA, $40M infrastructure award (2022); EPA, increased implementation grants (2026); EPA, FY2023 state SRF allotments; MD DNR, Chesapeake Bay Implementation Grant; Delaware DNREC FY26 CBIG RFP.
Other federal programmes. Chesapeake Bay Watershed Initiative, 2008 Farm Bill; NRCS, $22.5M targeted initiative; FWS Chesapeake WILD 2026, 2024, 2023; ACE Act reauthorisation; FY2026 appropriations detail; Maryland Matters, 19 January 2026; FY2026 Bay Program appropriation; CBF on the FY2027 request; Maryland Matters on Corps oyster costs.
Maryland. DLS Chesapeake Bay Overview FY2027 and FY2026; DLS 2026 Issue Papers; Bay Restoration Fund Advisory Committee report 2025 and 2026; MDE BRF programme page; DNR Trust Fund FY24–26 report; Trust Fund FY2026 round and FY2025 round; CWSRF Intended Use Plan FFY2025; Clean Water Commerce Act, Env. §9-1605.4; CWCA solicitation instructions; CWCA selections February 2025; MDE March 2025 and May 2026; Stormwater Financial Assurance Plan report, October 2025; Anne Arundel FY2020 WPRP report; MDA cover crop fact sheet 2025–26; MACS; Maryland water quality trading regulations; Maryland MBE programme; Baltimore County procurement; Anne Arundel full-delivery programme.
Virginia. Code §10.1-2128 (WQIF) and §10.1-2128.2 (Nutrient Offset Fund); §62.1-44.15:29.1 (SLAF); budget amendments 368 #4h, 365 #6h, 365 #2h, 362 #4h; DEQ WQIF; DEQ SLAF; DCR VACS; FY26 cost-share policy; VARTF full-delivery RFP; VARTF fee schedule 2025; Virginia Nutrient Credit Exchange Association; pay-for-outcomes pilot.
Pennsylvania. DEP WIP and CAP background; DEP December 2024 and December 2025; PDA on the Clean Streams Fund rollout; PENNVEST Clean Water Procurement Program and its award announcements (Feb 2024, Jul 2024, Aug 2025); DEP nutrient credit trading; Penn State Extension ACAP report; CBF on the Clean Streams Fund.
Award mechanics and markets. 2 CFR 200.332; 2 CFR 200.414; 33 U.S.C. §1383 (CWSRF); EPA Green Project Reserve guidance; NFWF Small Watershed Grants RFP 2026; NFWF February 2026 awards; Chesapeake Bay Trust; EPA 2021 trading and offsets summary; EPA Virginia trading case study; DOEE selling SRCs, in-lieu fee, price lock; TNC on ten years of the SRC market; D.C. Code §2-218.46; 33 CFR 332.8 (mitigation banking); Army Corps mitigation rule factsheet; EPA financial assurances factsheet.
The private vertical. Florida DBPR licence 35185 (HGS, LLC / RES Environmental Operating Company); RES on the Onex and KKR investments; RES acquires Angler Environmental; RES Maryland; Ecosystem Investment Partners fund V; EIP Cecil County; Wildlands Engineering; Ecotone mitigation credits; Wetland Studies and Solutions; Restoration Systems; KCI Technologies; UNC EFC, Prince George's case study; Prince George's CBP3 document; The Clean Water Partnership; EPA on the partnership; Harvard Extension capstone; EPA on DC Water's environmental impact bond and DC Water's outcome factsheet; Bion Environmental 10-K (Kreider shutdown, PENNVEST default); Center for Progressive Reform on Maryland trading; Bay Journal on stream restoration; testimony on failed restorations, HB1465; Underwood testimony on permitting, HB869; Rolband appointment to Virginia DEQ.
Method. Figures are quoted as published and labelled enacted, actual, appropriated, allowance or requested wherever the source distinguishes them; dollar-years are not inflated to a common year. Where we computed a figure it is marked as ours in the exhibit note. Each exhibit's data is available as a CSV of the name given in its note. This study names private companies only where a primary public record supports the claim, and makes no allegation of wrongdoing by any firm or official mentioned. Higgins Strategy is registered and disclosed; one principal is in every meeting; we never take both sides of a matter.
Read next
- Every Federal Job in the Region What happened to the federal payroll in Washington, Maryland and Virginia between January 2025 and August 2026.
- Every Pound of Nitrogen How much nitrogen is kept out of the Chesapeake Bay, how much still gets in and what each pound costs.
- What the Region Makes The economies of the District, Maryland and Virginia by industry since 1997, and how much of each is federal.