Study IV · The Federal Dollars Series
Every Federal Dollar
Where $7.01 trillion of federal money came from and went in 2025, traced to the account.
In fiscal year 2025 the federal government collected $5.23 trillion and spent $7.01 trillion. The $1.78 trillion difference was borrowed. Those three numbers are not in dispute; you can read them to the cent in Treasury’s final Monthly Treasury Statement, and every breakdown below sums to them exactly.
What is in dispute — permanently, and by design — is how to draw them. The federal budget has no natural picture. Every choice about what to include, what to net out, and what counts as a total is an argument, and the two most widely distributed budget graphics in America both make that argument by statute and by omission rather than by evidence.
This study lays out the whole flow; then the account level, where money is actually appropriated and almost no graphic goes; then how it was appropriated, which for most of the budget is a stranger answer than the civics textbook implies; then the century behind the shape; then the four large things no outlay chart can show; and finally a hundred and fifty years of people trying to draw this.
I. The flow
Start with the shape most graphics avoid, because it is the only one that shows the gap as a gap. Money in on the left, money out on the right, drawn to one scale. The borrowing is not a revenue source; it is the distance between the two columns.
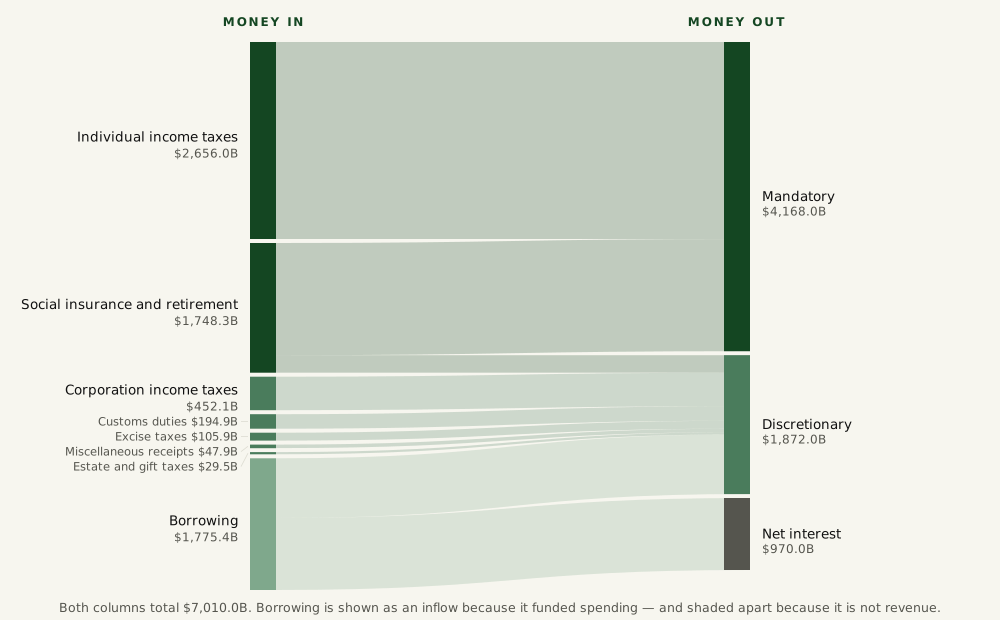
A quarter of what the government spent in 2025 was borrowed. That single ratio — 25.3 per cent — is the fact most budget graphics structurally cannot show, and Section IV explains why one of them is forbidden by law from showing it.
Where it comes from
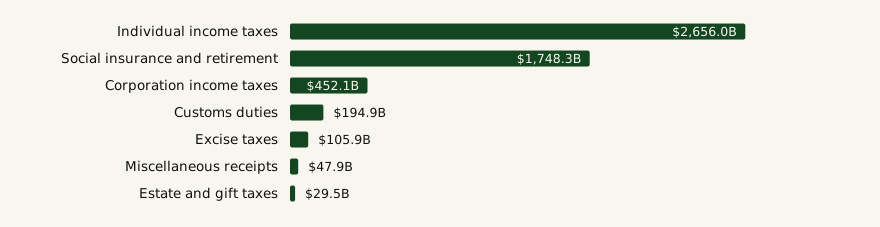
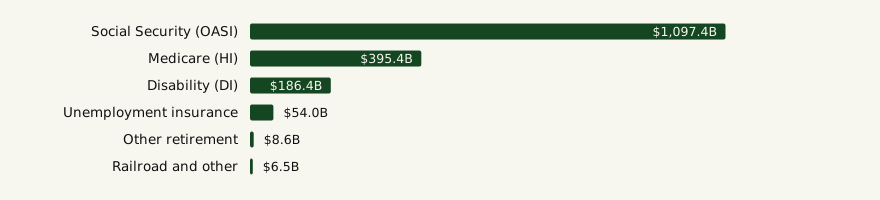
The second-largest line is not one tax but six, and they are not general revenue — each is levied for a named trust fund.
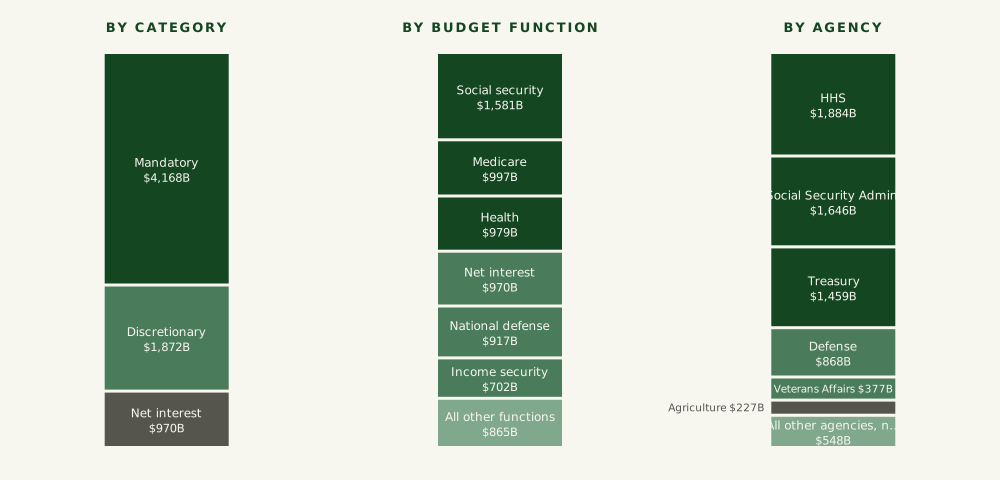
Where it goes — the same total, cut three ways
The next exhibit is the point of the whole study in one image. These three columns are the same $7.01 trillion. Nothing has been added or removed. Only the classification changes — and each classification supports a different sentence about what the government does.
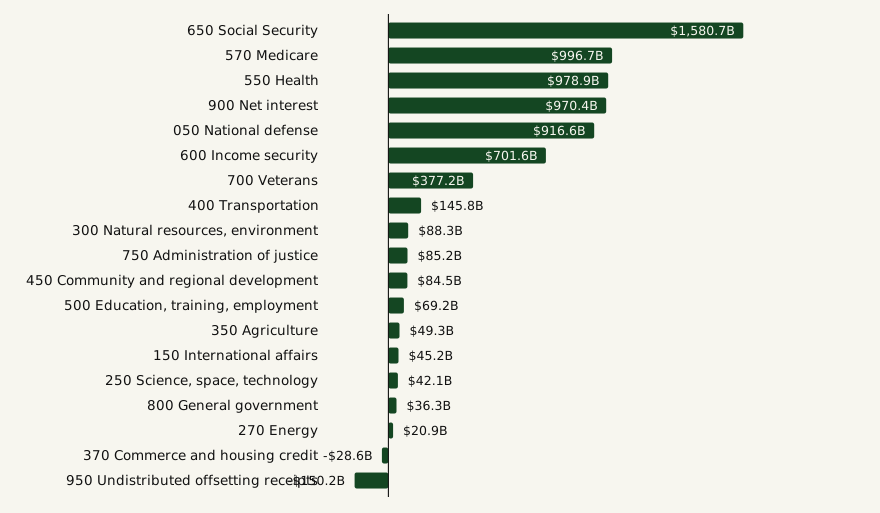
The full function table, since the eight-line summary above conceals two of the most interesting lines in the budget — both of them negative.
II. Below the agency: the account
Agencies and functions are summaries. Neither is a thing money is actually appropriated to. The unit where an appropriation lands, where an obligation is recorded, and where a Treasury symbol is assigned is the account — and almost no public budget graphic ever goes there.
The structure is precise. Treasury assigns every appropriation, receipt and fund a Treasury Account Symbol: an agency identifier, a period of availability, a main account code and a sub-account. Drop the sub-account and you have a Treasury Appropriation Fund Symbol, the level at which agencies actually report execution. Drop the period of availability too and you have a federal account, the level USAspending publishes. The President’s Budget Appendix uses a parallel eleven-digit budget account code whose last three digits are the budget function — which is the structural reason functions are built up from accounts rather than the other way round.
Three real symbols make it concrete. 015-X-0200-000 is the FBI’s salaries and expenses
account, where X means no-year money that never expires. 086-2021/2030-0302-000 is
HUD tenant-based rental assistance, available from 2021 through 2030. And
075-015-2025/2025-1060-003 is an allocation transfer: the money is Health and Human Services’,
the account is the Justice Department’s Federal Prison System. An agency total cannot show you
that.
There are more than two thousand federal accounts. Twenty of them do most of the work.
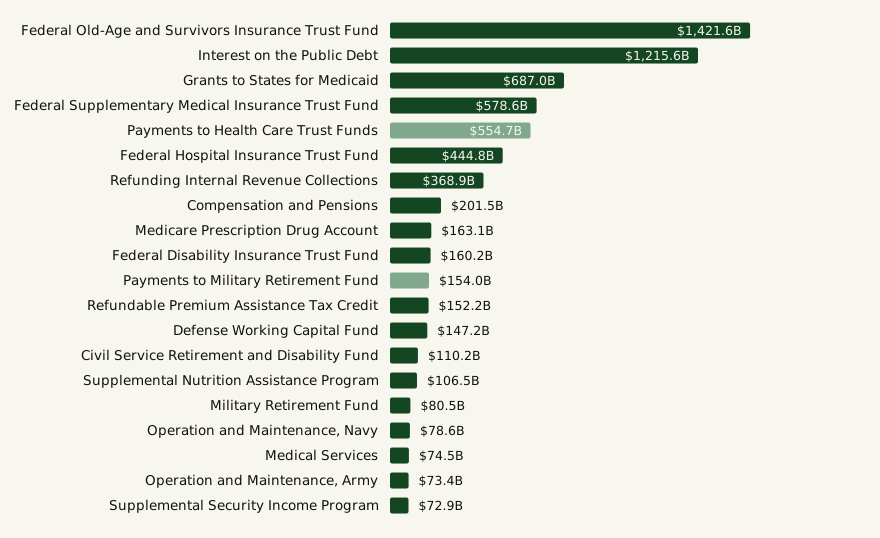
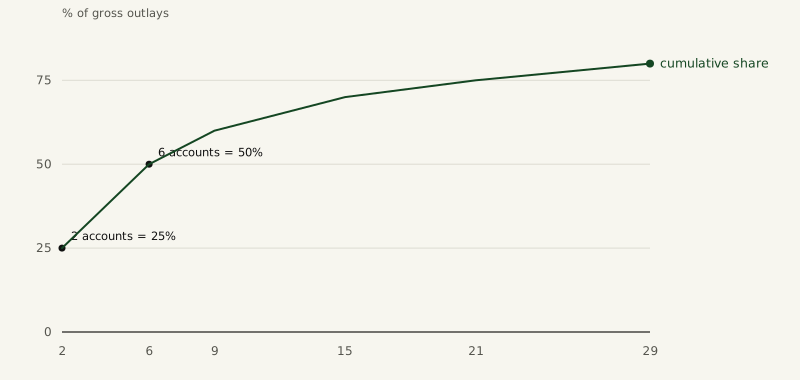
The concentration is not a gentle curve. It is a cliff.
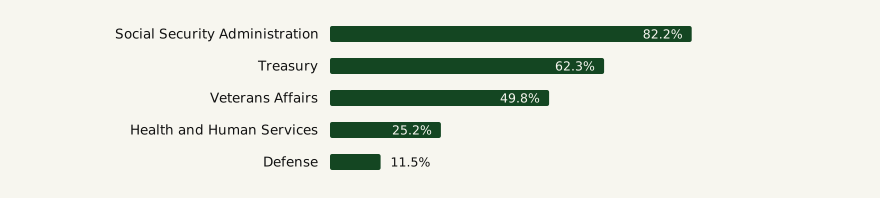
And the shape differs so sharply between agencies of similar size that the agency layer actively conceals it.
The tail
Concentration at the top implies a very long tail at the bottom, and the Social Security Administration — the most concentrated agency in government — makes it visible. Its twelve accounts span nine orders of magnitude.
| Account | FY2025 gross outlay |
|---|---|
| Old-Age and Survivors Insurance Trust Fund | $1,421,619,693,055.71 |
| Payment to Limitation on Administrative Expenses | $1,014,628.22 |
| Special Benefits for Certain World War II Veterans | $326,492.29 |
| Admin Costs, Medicare Improvements for Patients and Providers Act | $26,919.13 |
| Admin Expenses, Children's Health Insurance Program | $26,050.38 |
| Payments for Credits Against Social Security Contributions | $3,607.87 |
One account, four true numbers
Take Grants to States for Medicaid — federal account 075-0512, Health and Human Services, Centers for Medicare & Medicaid Services, budget function 550 and subfunction 551, a mandatory appropriated entitlement, funded for FY2025 by Division A of the full-year continuing resolution. One account, one fiscal year, four published figures:
- $724.4 billion — obligations (USAspending)
- $687.0 billion — gross outlays (USAspending)
- $672.3 billion — FY2025 actual, CMS congressional justification
- $668 billion — net outlays (CBO)
Every one is correct on its own basis. The spread is $56.7 billion — larger than the entire budget of the Department of Commerce. An infographic that mixes bases silently is not slightly wrong; it is wrong by more than a cabinet department.
III. How it was appropriated
Here is the question everything above is building toward, and the answer is not what the civics textbook implies.
For fiscal year 2025, Congress enacted none of the twelve regular appropriations bills. Not late. Never. Zero were enacted by 1 October 2024, and zero were enacted at any point thereafter. The House passed five by late July 2024; the full Senate considered none. The entire discretionary budget of the United States ran the year on continuing resolutions, and from 15 March 2025 on a full-year continuing resolution that set FY2025 spending by reference to FY2024 levels.
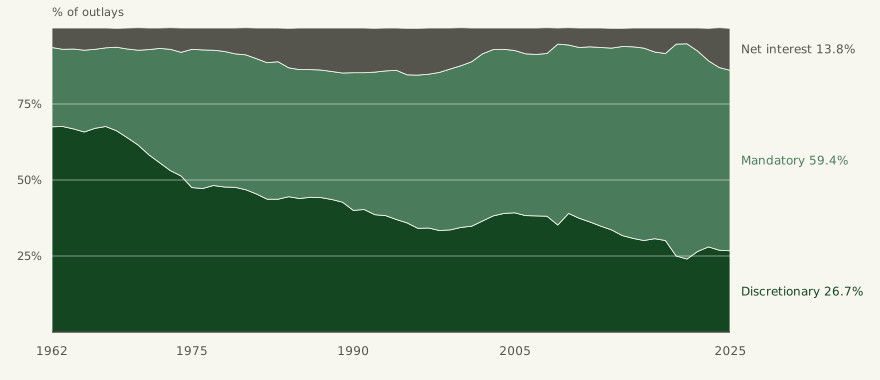
And discretionary spending is only about a quarter of the budget to begin with.
First, a distinction that most treatments skip
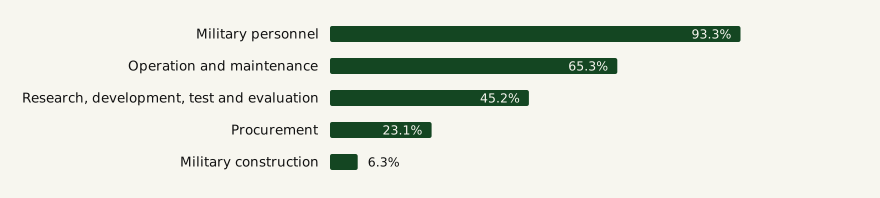
An appropriation grants budget authority — permission to incur obligations. Outlays are cash leaving the Treasury. The chain runs appropriation to budget authority to obligation to outlay, and each step can take years. A single year’s outlays are a blend of authority enacted this year and unexpended balances from earlier ones. There is no reason the two totals should match, and they do not.
How fast authority becomes cash varies enormously by what is being bought.
Most of the money was not appropriated this year, or any year
Interest on the public debt is appropriated permanently by 31 U.S.C. § 1305, which provides that “necessary amounts are appropriated… to pay interest on the public debt.” Social Security operates through trust funds under 42 U.S.C. § 401, which appropriates payroll receipts to the funds; benefits are payable without any annual action. Medicare, federal retirement and most of the rest of mandatory spending work the same way. None of it appears in an appropriations bill in any year.
But “mandatory” and “permanently appropriated” are not synonyms, and the difference is the part most treatments get wrong. A large class of programmes — appropriated entitlements — has its spending level fixed by authorising law but receives its actual budget authority through the annual bills. Medicaid, SNAP, Supplemental Security Income and veterans’ compensation are all in this class. It is exactly why the 2025 shutdown threatened SNAP: mandatory spending sitting inside the Agriculture appropriations bill.
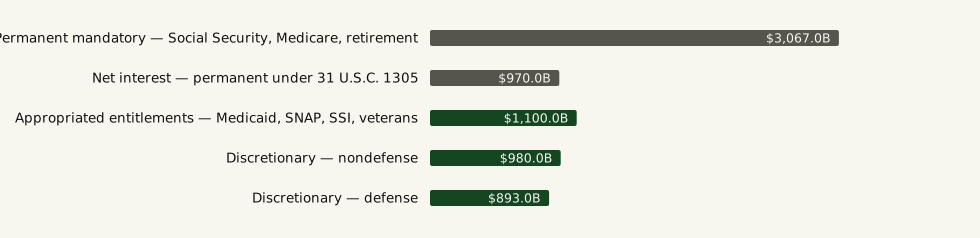
And even the quarter that is discretionary overstates what was decided in FY2025. Some of those outlays liquidated authority enacted in earlier years. More decisively: FY2025’s discretionary budget authority was not set by any FY2025 appropriations bill. It was carried forward from FY2024 by formula.
The record
| Signed | Public law | Act | What it did |
|---|---|---|---|
| 26 Sep 2024 | P.L. 118-83 | Continuing Appropriations and Extensions Act, 2025 | Continuing resolution through 20 December 2024 |
| 21 Dec 2024 | P.L. 118-158 | American Relief Act, 2025 | CR through 14 March 2025; roughly $110B disaster supplemental |
| 15 Mar 2025 | P.L. 119-4 | Full-Year Continuing Appropriations and Extensions Act, 2025 | Full-year CR through 30 September 2025 covering all twelve bills. $1.60 trillion base discretionary budget authority at FY2024 levels. All earmarks zeroed by section 1111 |
| 4 Jul 2025 | P.L. 119-21 | One Big Beautiful Bill Act (reconciliation) | $156.2B of mandatory defence budget authority, outside the appropriations process entirely |
| 24 Jul 2025 | P.L. 119-28 | Rescissions Act of 2025 | Cancelled roughly $9B — foreign assistance and public broadcasting |
| 28 Aug 2025 | — (special message) | “Pocket rescission” | Proposed rescinding ~$4.9B of expiring foreign assistance. GAO holds the practice unlawful; litigation unresolved |
| 12 Nov 2025 | P.L. 119-37 | Continuing Appropriations … and Extensions Act, 2026 | Ended the 43-day shutdown. Enacted three full-year bills; CR for the rest through 30 January 2026 |
| 23 Jan 2026 | P.L. 119-74 | Commerce-Justice-Science; Energy-Water; Interior Appropriations Act, 2026 | Three more full-year bills |
| 3 Feb 2026 | P.L. 119-75 | Consolidated Appropriations Act, 2026 | Ended a second, three-day lapse. Five full-year bills; further CR for Homeland Security |
| 30 Apr 2026 | P.L. 119-86 | Homeland Security and Further Additional Continuing Appropriations Act, 2026 | Ended the 75-day Homeland Security lapse and completed all twelve FY2026 bills — seven months into the fiscal year |
| 2 Sep 2026 | P.L. 119-103 | Continuing Appropriations and Extensions Act, 2027 | CR through 11 December 2026. FY2027 will also begin with none of the twelve enacted |
Two footnotes to that table are worth stating on their own.
In FY2026 Congress enacted all twelve bills with no enforceable allocations at all. CBO recorded in February 2026 that “no official allocations for 2026 have been established for the House Committee on Appropriations or its subcommittees.” The section 302(a) and 302(b) allocations that the Congressional Budget Act of 1974 built the whole process around simply were not made.
And roughly $500 billion of FY2025 appropriations went to programmes Congress never reauthorised. CBO identified 457 expired authorisations carrying FY2025 appropriations. House Rule XXI bars appropriating for unauthorised programmes; the rule is not self-enforcing and a Member must raise it.
How unusual is any of this?
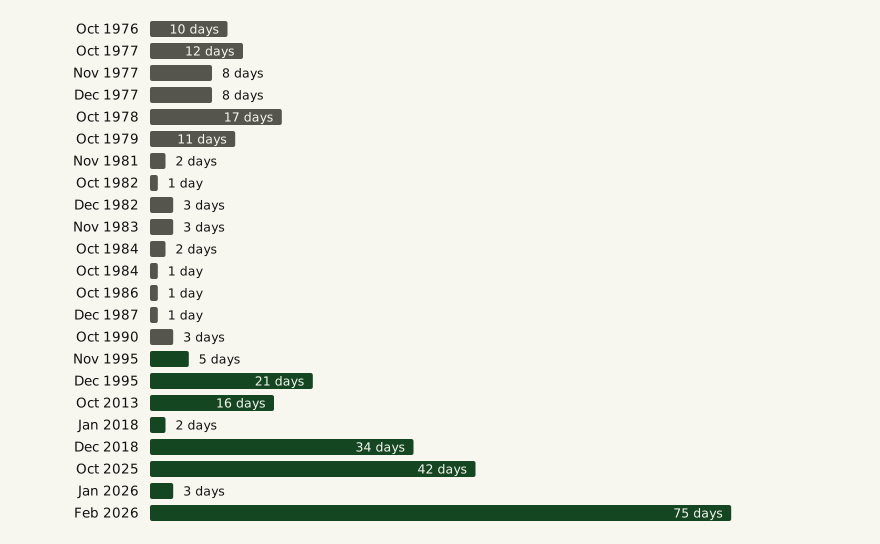
Not unusual at all, which is the point. Congress has enacted all twelve regular appropriations bills on time exactly four times since fiscal year 1977: FY1977, FY1989, FY1995 and FY1997. None since. In thirteen of the past fifteen fiscal years it passed not a single bill by 1 October. Since FY1998 the average gap between the start of the fiscal year and enactment of the final bill is 117 days.
The failures show up as funding gaps.
IV. The century
One year tells you almost nothing. The shape of the modern federal government was set between 1935 and 1975, and every current argument is downstream of four structural changes that are visible in the long series and invisible in any single year.
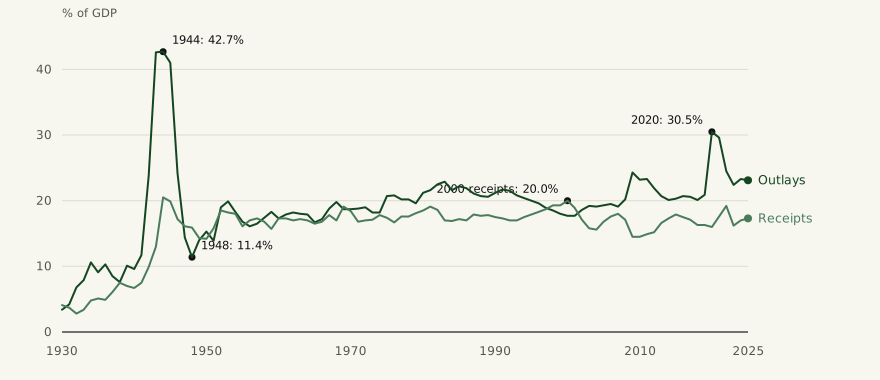
The receipts line is remarkably stable. What it is made of is not.
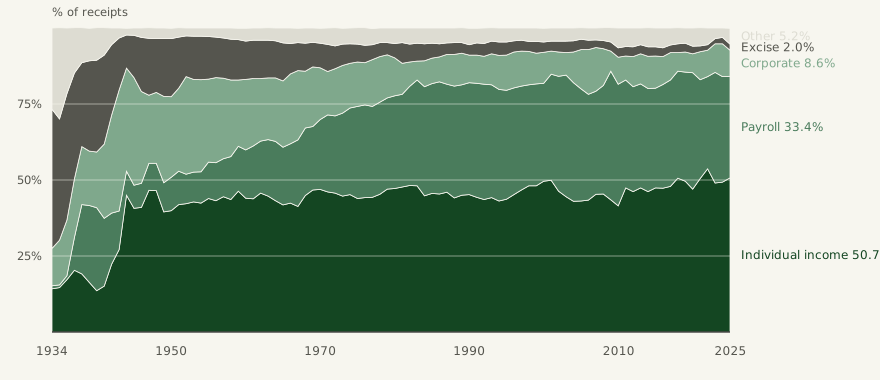
And on the spending side, the single most consequential trend in American public finance — the one that determines how much of the budget any Congress can actually decide.
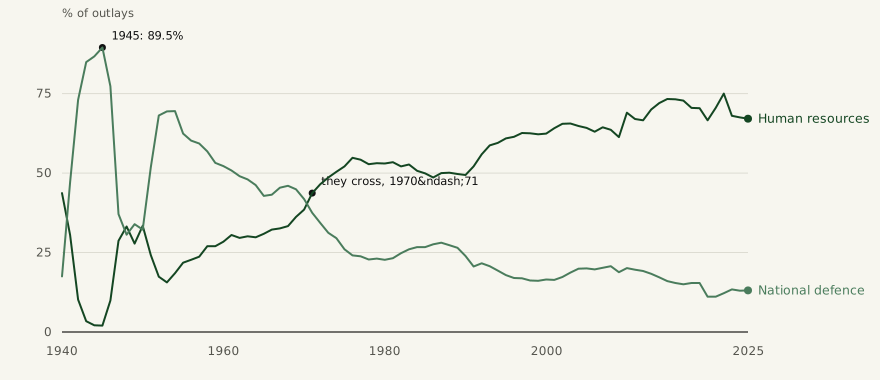
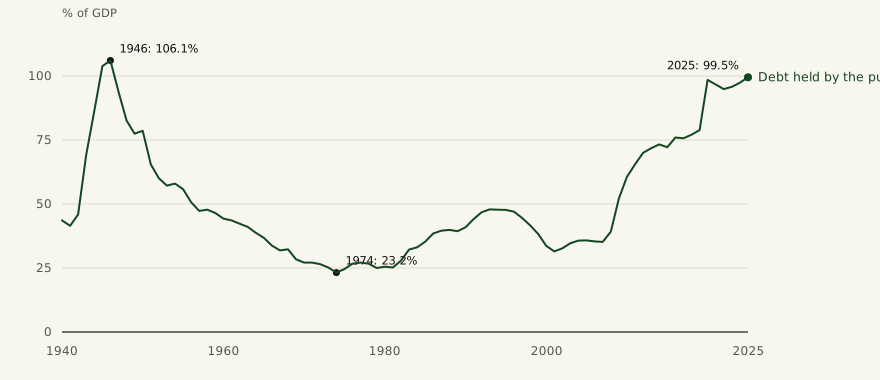
Two consequences of that debt level are worth separating, because they are usually confused. The interest burden is now at a record share of outlays — 13.8 per cent in 2025, above national defence at 13.1 — and at 3.2 per cent of GDP it matches the 1991 record exactly. But the rate is not the problem. The effective interest rate on debt held by the public was about 9.9 per cent in 1982 and about 3.3 per cent in 2025. Today’s record interest burden comes from a debt roughly four times larger relative to GDP, at one third the rate.
The counter-intuitive one
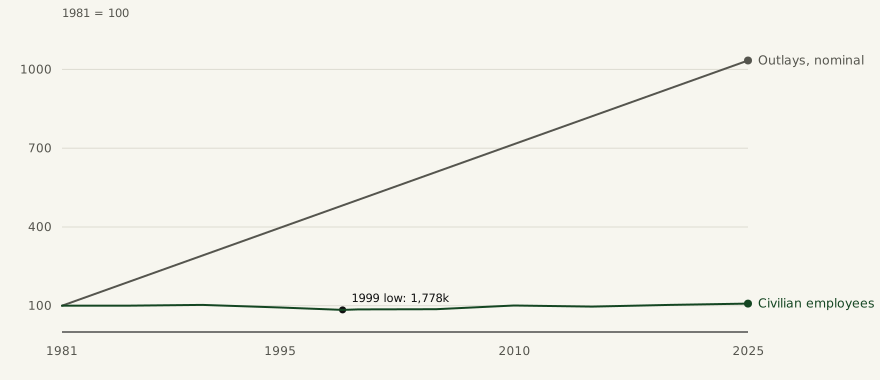
A government that spends ten times what it spent in 1981 must employ vastly more people. It does not.
V. Four things no outlay chart can show
Everything to this point is inside the published totals. The rest of federal fiscal policy is not, and it is not small. These four items are each larger than the entire discretionary budget.
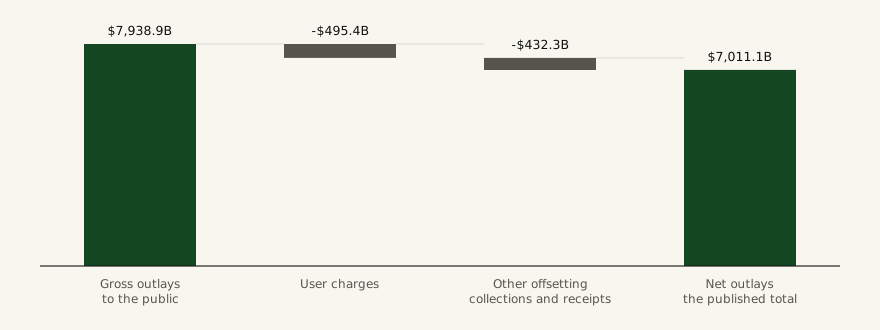
1. A trillion dollars is netted out before the chart is drawn
Collections from what the budget calls “business-like or market-oriented activities” — Medicare premiums, Postal Service fees, TVA electricity sales, federal employee health contributions — are subtracted from outlays rather than added to receipts. The published $7.01 trillion is a net number.
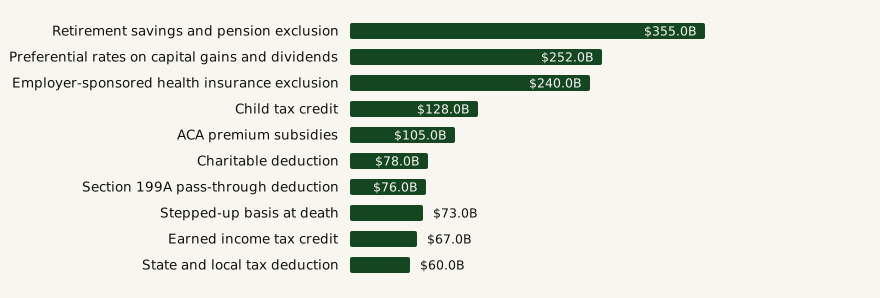
2. Roughly $2.2 trillion of fiscal policy runs through the tax code
A deduction, exclusion, credit or preferential rate does the work of a spending programme and appears in no outlay table. The Congressional Budget Act of 1974 named them tax expenditures. Neither official estimator publishes a total — for a reason worth stating precisely.
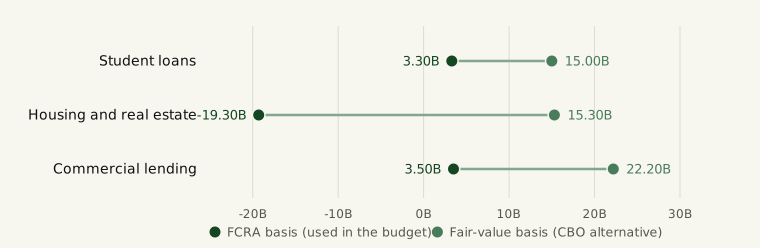
3. $1.9 trillion of credit assistance scores as a saving
Under the Federal Credit Reform Act of 1990, loans and guarantees enter the budget at the present value of expected net cost, discounted at Treasury rates. CBO also publishes a fair-value estimate that adds the market risk premium those Treasury rates omit. The two answers differ in sign.
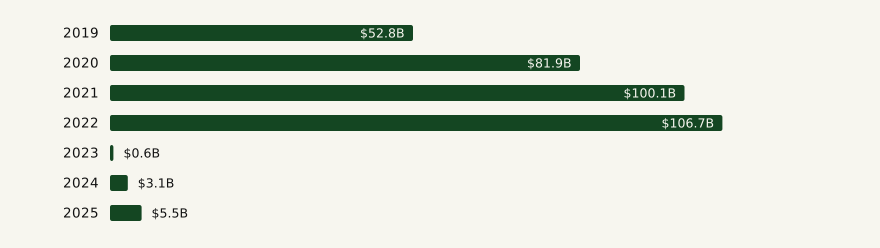
4. A $100 billion revenue line vanished without legislation
VI. A hundred and fifty years of drawing this
The striking thing about the history is where it starts, and where it does not. It does not start with the Treasury. I checked the Annual Report of the Secretary of the Treasury for 1922 and the Budget of the United States Government for fiscal 1936 — the latter produced by a Bureau of the Budget already fifteen years old, in the most visually experimental decade of American government publishing. Both are narrative, schedules and tables. No charts. An agency that publishes only tables is asserting that the budget is a matter of record, not of persuasion.
It starts instead with the Census. The 1874 Statistical Atlas of the United States, compiled by Francis Amasa Walker and lithographed by Julius Bien, contains Plate 33: “Fiscal Chart of the United States Showing the Course of the Public Debt by Years 1789 to 1870. Together with the Proportion of the Total Receipts from each Principal Source of Revenue and the Proportion of Total Expenditures for each Principal Department of the Public Service.” That is the ancestor of every “where it comes from, where it goes” graphic since, and its structural choice is the one that matters: it puts receipts, expenditures and debt on a single time axis, as proportional bands. Composition and trajectory at once — precisely what the pie chart later gave up.
The high-water mark came nine years later. The atlas of the 1880 census devoted seven plates to federal finance alone, including “Analysis of Receipts, 1789–1880” and “Analysis of Expenditures, 1789–1880.” That is more than any official American publication has given the subject since. By the 1890 atlas the composition plates are gone and only debt remains. By the 1920 atlas there are no government finance plates at all.
So federal fiscal graphics were born in the Census atlas, peaked in 1883, vanished by 1925 — and reappeared twenty-five years later as something different in kind: a persuasion product. The Bureau of the Budget’s The Budget in Brief, first edition January 1950, opens with “Where the Money Will Come From” and “Where the Money Will Go,” and its own text performs the oldest trick in the genre: “The four large items are costing 71 percent; all other activities of Government only 29 percent.” Aggregate to make a share look large. The government did it first.
| Year | Artifact | Maker | What it did |
|---|---|---|---|
| 1874 | Fiscal Chart of the United States, Plate 33 | Francis A. Walker, Census Office; lith. Julius Bien | First federal budget graphic: debt 1789–1870 with proportional bands of receipts by source and expenditures by department |
| 1883 | Statistical Atlas of 1880, plates 70–84 | Hewes and Gannett, Census Office | Seven plates on federal receipts, expenditures, debt and loans — the deepest official visual treatment ever published |
| 1914 | Graphic Methods for Presenting Facts | Willard Cope Brinton | First US book on the subject. Opens with a “where your fare goes” divided bar and rejects the sector circle for exactly this data |
| 1922 | Annual Report of the Secretary of the Treasury | Treasury Department | Tables only. No charts (verified in full text) |
| 1925 | Statistical Atlas of 1920 | Census Bureau | Government finance plates gone entirely |
| 1936 | Budget of the United States Government | Bureau of the Budget | Still text and tables. No charts |
| Jan 1950 | The Budget in Brief, FY1951 | Bureau of the Budget | First popular federal budget graphic: “Where the Money Will Come From” / “Where the Money Will Go” |
| 1967–68 | The unified budget | President’s Commission on Budget Concepts | Merged trust and federal funds — the accounting change every later share-of-budget dispute turns on |
| 1984– | “Where Your Income Tax Money Really Goes” | War Resisters League | Annual counter-pie: federal funds only, 80% of debt interest attributed to past military |
| 1984 | “Graphical Perception” | Cleveland and McGill, JASA | Empirical ranking placing angle below position and length — the perceptual case against pies |
| Nov 1990 | 26 U.S.C. § 7523 | Congress, Pub. L. 101-508 § 11622(a) | Mandated two pie charts in the Form 1040 booklet, named the categories in statute, and put borrowing on the income side |
| 2004–2016 | Death and Taxes poster | Jess Bachman | 500+ programmes as proportional circles — discretionary spending presented as the budget |
| Nov 2010 | “Budget Puzzle: You Fix the Budget” | New York Times | Reader closes the 2015 and 2030 gaps from a fixed menu |
| Apr 2011 | Federal Taxpayer Receipt | White House (concept: Porter and Kendall) | Personalised allocation of one household’s taxes; omitted borrowing and tax expenditures |
| Feb 2025 | Federal budget Sankey | USAFacts | FY2024 flow chart showing the deficit as an unmatched flow — the opposite of the § 7523 solution |
The statute that drew the picture
The single most consequential fact in this history is that Congress legislated a chart.
26 U.S.C. § 7523, “Graphic presentation of major categories of Federal outlays and income,” was added by the Omnibus Budget Reconciliation Act of 1990 and applies to instruction booklets for taxable years after 1990. It requires the Secretary to include in the Form 1040 instructions two pie-shaped graphs. It does not leave the categories to Treasury — it names them in the law: six outlay categories and five income categories.
Two things follow, and both are load-bearing.
Congress legislated a taxonomy, not just a chart. The six-slice classification is a statutory artifact of 1990. It is not how OMB classifies spending, nor CBO, nor the Financial Report. Anyone comparing the 1040 pie to a CBO chart is comparing two different definitions of the same budget.
And § 7523 puts borrowing on the income side. This is the design decision that governs how tens of millions of Americans see the federal budget every spring. It makes the deficit look like a revenue source rather than a gap, and it forces the two circles to be the same size — outlays can never visibly exceed income. The current presentation shows borrowing at 28 per cent of “income.” Compare Exhibit 1, where the same fact is drawn as a distance.
The irony runs deeper. In 1914 — seventy-six years before Congress mandated the pie — Willard Cope Brinton opened the first American book on information graphics with a “where your fare goes” divided bar, and then showed a sector circle in order to reject it: “The circle with sectors is not a desirable form of presentation, however, because it does not have nearly such flexibility.” He objected to the reversed lettering and to “the impossibility of placing figures in such manner that they can be easily compared or added.” Cleveland and McGill established the same conclusion empirically in 1984, six years before the statute.
Why the pie is the wrong instrument — the real reason
The perceptual objection is true but secondary. The real defect is that a pie must declare a total, and the choice of total is the argument.
Federal funds or the unified budget? Discretionary or all outlays? Gross outlays or net of $928 billion in offsetting collections? Is borrowing a revenue slice, as § 7523 requires, or an unmatched flow, as USAFacts draws it? Do tax expenditures appear at all — they cannot, in any outlay-based figure, which is why roughly $2.2 trillion of annual fiscal policy is structurally invisible in every graphic in this history.
Both political directions exploit exactly this. The War Resisters League has published “Where Your Income Tax Money Really Goes” annually since 1984, reporting a military share in the high thirties to mid sixties against an official figure near sixteen per cent; its method is stated openly and is entirely a set of boundary decisions — federal funds only, excluding trust funds, and 80 per cent of interest on the debt attributed to past military spending, a share it defends on the reasoning that without military spending “most of the national debt would have been eliminated.” In the opposite direction, PolitiFact rated False a viral chart claiming 57 per cent of federal spending goes to the military; it had counted only discretionary spending while labelling itself total federal spending, omitting roughly 60 per cent of the budget.
Neither is arithmetic fraud. Both are denominator choices that the circle has no room to disclose. The 1874 Fiscal Chart, the divided bar and the Sankey all leave room to show the seam.
What to ask of any budget graphic
What is the total, and why that one? Unified or federal funds; gross or net; all outlays or discretionary only. Every serious dispute in this subject is a dispute about the denominator.
Where is the borrowing? A quarter of FY2025 spending. If it is a slice of income, the chart is drawn to a statutory convention that guarantees the two circles match.
What was netted out? $927.8 billion before the published total, and $1.25 trillion more intragovernmentally that appears nowhere.
Is anything here not a cash flow? Credit re-estimates moved $131 billion in September 2025 without a dollar changing hands.
Has the year been adjusted for timing? Because 1 October 2023 fell on a weekend, $72 billion shifted between fiscal years. FY2025’s deficit was 2 per cent below FY2024’s as recorded and 6 per cent below it adjusted.
What we could not verify
- OMB Historical Table 1.1’s exact on/off-budget split for FY2025. The FY2027 Historical Tables are published as spreadsheets only and one table could not be parsed. CBO’s split is used instead and may differ by a few billion.
- Current agency-level gross-versus-net outlays. OMB last published that table in the FY2009 Analytical Perspectives. We confirmed it is absent from the FY2018, FY2021, FY2024 and FY2027 editions. The FY2007 ratios — Interior’s net figure understating gross by 37%, HHS by $68B — are real but historic, and are deliberately not charted here as current.
- The precise FY2025 interest credited to government accounts. GAO’s audit implies roughly $200B; the Joint Economic Committee reports $302.6B on a differently constructed twelve-month basis. Unreconciled, so no figure is charted.
- Any pre-1990 voluntary “tax dollar” chart in the Form 1040 booklet. Pre-1991 IRS scans are images without text recognition. We could not read them and make no claim about what preceded the statute.
- Any wartime Treasury “where your tax dollar goes” graphic. Searched, not found. We do not assert one existed.
- Whether charts entered the Treasury reports or the President’s Budget between 1936 and 1950. We sampled two years; we did not sweep the run.
- FY2026 actuals do not exist. The fiscal year ends 30 September 2026. Every figure here is FY2025 or earlier, and any FY2026 comparison in circulation is a partial year containing a 43-day shutdown, roughly $54B of deferred spending, about $100B of tariff refunds, a $9.0B rescission and a disputed $4.9B pocket rescission.
One reconciliation we can state exactly. Three published FY2024 deficit figures are in circulation: $1,832.8B as originally published, and $1,816.8B as restated in the FY2025 statement. Both are correct in their own document. For a year-over-year comparison use the restated column so both years sit on one basis — and adjust for the $72B timing shift before drawing any conclusion from the change.
Read next
- Every Federal Dollar, Mapped
- Who Pays and Who Gets
- Every Dollar of War Defense, veterans and the world since 1940, per resident and in fiscal 2025 dollars, and what it bought.