Study V · Part Two · The Federal Dollars Series
Who Pays and Who Gets
Who pays the $9.8 trillion of federal money and who receives it, by tax, state, income and race.
Part One mapped the accounts and followed the dollar through the Treasury. It left three questions that the account map cannot answer by itself, because each needs a different cut of the same money. What was the money for — a benefit, a grant, interest, a salary, a contract, a building — and which accounts carry each kind? Who paid it in, by income and by place? And who got it back, by place, by income and, where a federal source is willing to say, by race? This part answers each with one plate, on the source’s own basis, with the basis printed on the plate.
The rule of Part One holds. Every figure has a primary source and a method in the same block; every basis difference is labelled rather than smoothed; nothing that could not be verified is drawn. Three of the sources here were fetched as files rather than pages — the government-wide object-class file from USAspending, the IRS Data Book table, the Veterans Affairs expenditure workbook — and each was checked against its own published total before use.
XI. Money out, by what it was for
The budget classifies every obligation by object class: what the money bought. Sort FY2025’s $9.8 trillion of gross outlays that way and the government is six things. Benefits to people are a third of it, and five accounts — the two Social Security funds and the three Medicare accounts — are 78 per cent of the benefits. Grants and subsidies are a quarter, and Medicaid alone is 29 per cent of the grants; the next largest item in that panel is not a grant at all but the general fund’s payment into the Medicare trust funds, which the budget codes as a contribution and which is hatched because it is money moving from one federal account to another. Interest is an eighth, in one account. Federal personnel is a tenth, and the largest single line is again a transfer — the accrual Defense pays into the Military Retirement Fund — with the three services’ pay accounts and VA medical staff behind it. Contracts, services and supplies are an eleventh, led by the Defense Working Capital Fund, which is a revolving fund the services buy from and therefore counts their spending a second time, then the premiums the government pays private carriers for its employees’ health insurance, then the four operation-and-maintenance accounts. Acquisition of assets — ships, aircraft, buildings, land — is two and a half per cent, almost all of it Defense. The plate lists, for each kind, the fifteen accounts that carry most of it and how many accounts carry the rest.
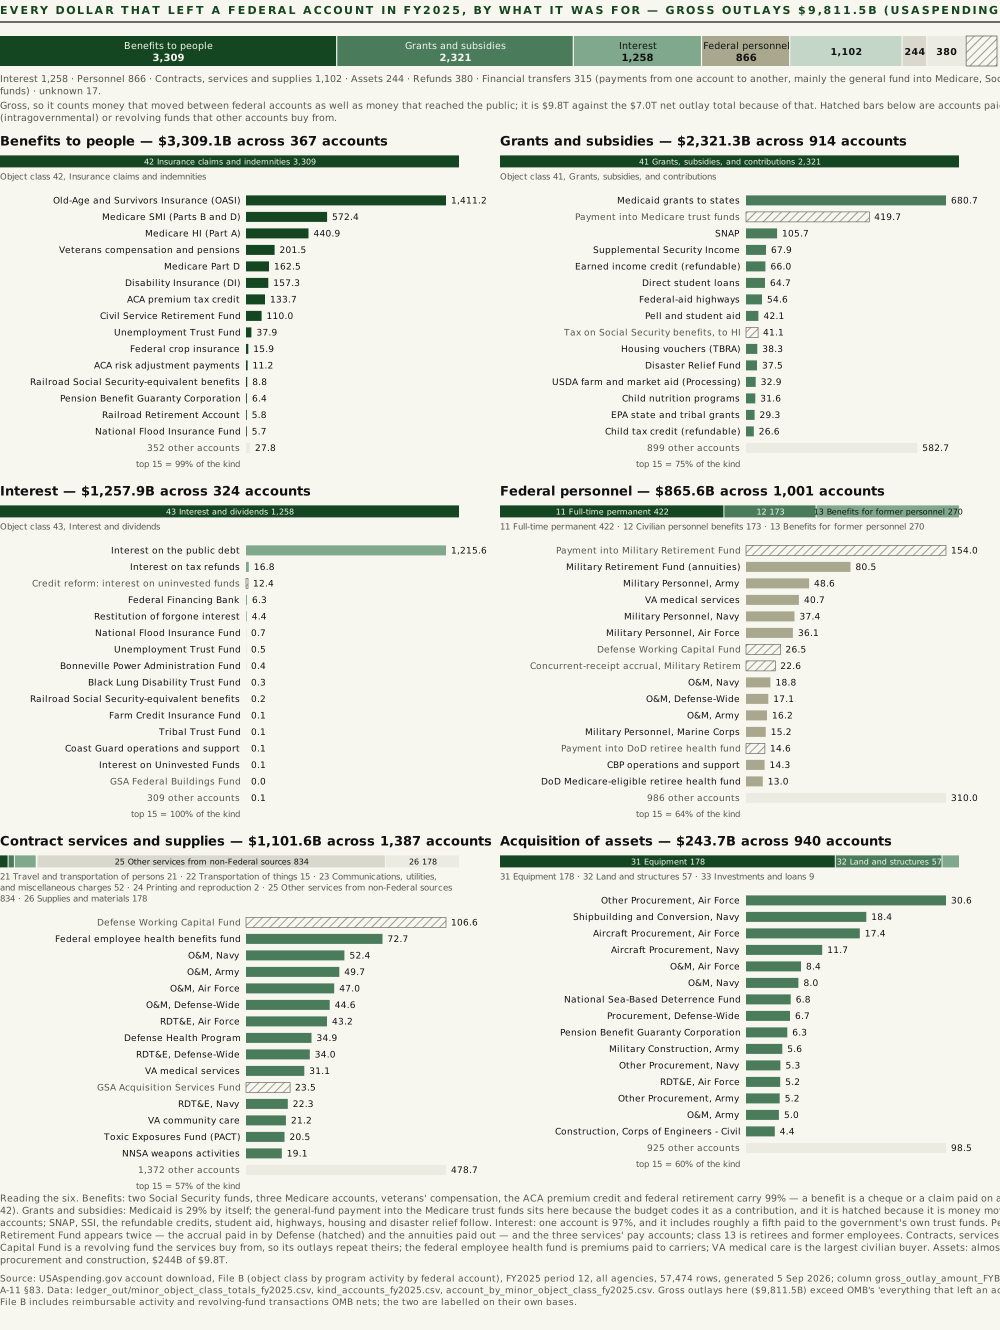
gross_outlay_amount_FYB_to_period_end. Object-class definitions from OMB Circular A-11, section 83. Method. Rows are grouped by the two-digit object class: 42 insurance claims and indemnities is benefits to people; 41 grants, subsidies and contributions is grants and subsidies; 43 is interest; 11–13 (pay, civilian benefits, benefits for former personnel) is federal personnel; 21–26 (travel, transport, utilities, printing, other services, supplies) is contract services and supplies; 31–33 (equipment, land and structures, investments and loans) is acquisition of assets; 44 refunds, 94 financial transfers and the unclassified remainder are shown in the header strip only. Within each kind, accounts are ranked by gross outlays and the top fifteen drawn; the sixteenth bar is everything else. Hatched accounts are paid by other federal accounts (general-fund payments into trust funds, accruals into retirement funds, the tax on Social Security benefits credited to Medicare) or are revolving funds that other accounts buy from (the Defense Working Capital Fund, GSA’s two funds, the Corps’ revolving fund); both are real cash movements and both are counted twice at the gross level. The total, $9,811.5B, is larger than OMB’s $9,188.6B in Plate XII because File B includes reimbursable and revolving-fund activity that OMB nets; the two are labelled on their own bases and neither is the $7,010.0B net figure. Data: ledger_out/minor_object_class_totals_fy2025.csv, kind_accounts_fy2025.csv, account_by_minor_object_class_fy2025.csv.XII. Money in, by view
Three views of the same $5.2 trillion. By tax, half is the individual income tax and a third is payroll tax, and the corporate tax, customs, excise and the estate tax together are the last sixth. By bracket, the individual income tax is the most concentrated thing the government collects — the top one per cent of returns pays 38 per cent of it on 21 per cent of the income — and the payroll tax is the least: the bottom three fifths of households pay 30 per cent of payroll tax and 0.3 per cent of income tax, which is why CBO’s average federal tax rate runs from 1.4 per cent in the lowest fifth to 31.5 per cent in the top one per cent rather than from zero to something higher. By state, the IRS books $60,067 per resident for the District of Columbia and $5,289 for West Virginia, and the panel says why that is not a measure of burden: the IRS records a collection at the address on the return, so DC carries the withholding of federal payrolls, Nebraska carries Omaha’s corporate filers, and Delaware and South Dakota carry the trusts sited there. The residence-based allocation is in Plate XIII; this is the cash as booked.
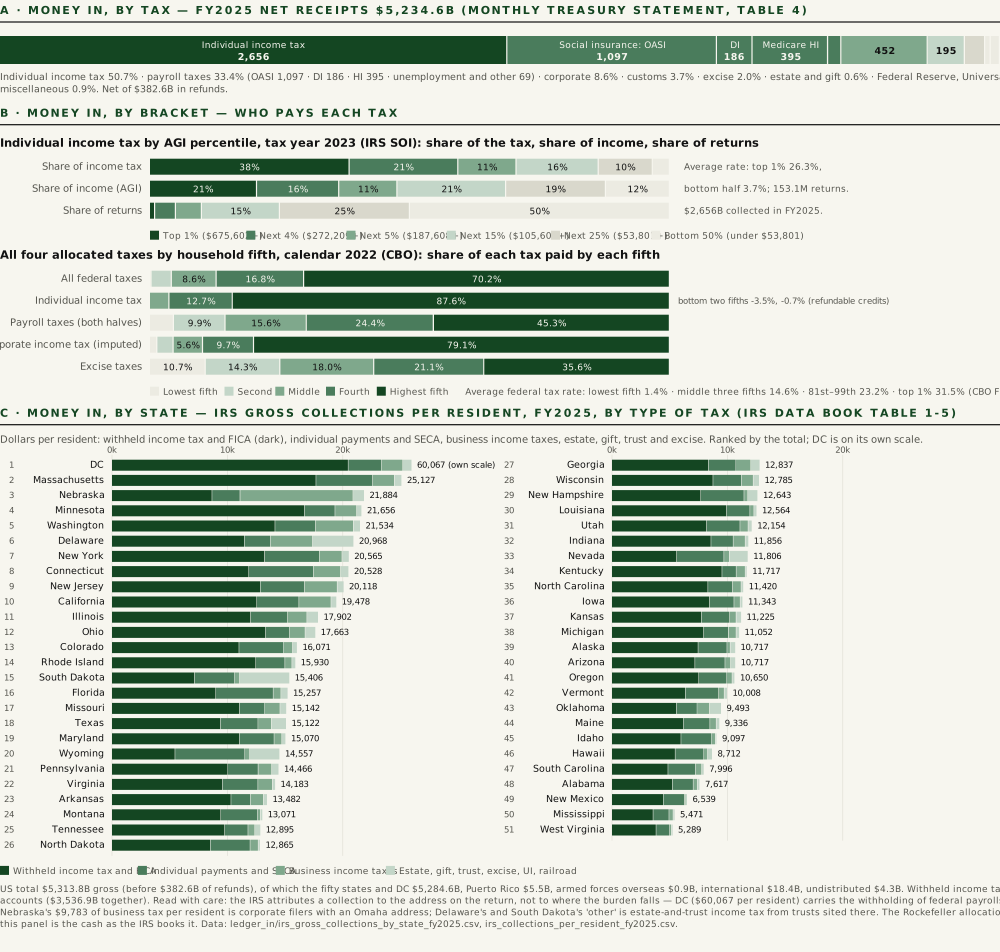
25db-1-05-co.xlsx); Census Bureau Vintage 2025 state population estimates, July 1 2025. Method. Panel A is net of $382.6B in refunds and sums to the published $5,234.6B. Panel B’s two blocks are on different bases and are not combined: the IRS block is tax-year 2023 returns ranked by adjusted gross income; the CBO block is calendar-2022 households ranked by size-adjusted income before transfers and taxes, with the employer half of payroll tax and a share of corporate tax imputed to households, and negative shares for the bottom two fifths of income tax written beside the bar rather than drawn. Panel C divides each state’s gross collections by its 2025 resident population; withheld income tax and FICA are one IRS line and cannot be separated; ‘other’ is estate and trust income tax, estate, gift, excise, unemployment and railroad taxes. The fifty states and DC sum to $5,284.6B of the $5,313.8B gross total; the rest is Puerto Rico, armed forces overseas, international and undistributed. DC is drawn on its own scale. Data: ledger_in/irs_gross_collections_by_state_fy2025.csv, irs_collections_per_resident_fy2025.csv, cycle_household/household_cycle_cy2022.csv.XIII. Benefits to people, by who gets them
The six largest programmes that pay people — Social Security, Medicare, Medicaid, veterans, SNAP and SSI — put about $2.9 trillion a year into households, and each publishes where it goes on a different basis and for a different year. Per resident, West Virginia gets the most from the six together, $11,196, and Utah the least, $5,443, and the order is mostly age: the states at the top are old and the states at the bottom are young. By income, CBO’s fifths show two different governments. Social Security and Medicare are flat across the fifths, about $10,000 and $6,000 a household whether the household is in the lowest fifth or the highest, because they follow age; Medicaid, SNAP and SSI fall by four-fifths from the lowest fifth to the highest, because they follow income. By race, the plate shows each programme against the population and against the population in poverty, on each source’s own categories, and does not harmonise them, because they cannot be harmonised: the Census counts race alone including Hispanics, USDA and CMS count non-Hispanic races with Hispanic as its own group, CMS’s Medicare codes understate Hispanic and Asian beneficiaries by its own Inspector General’s finding, Treasury imputes race from names and geography, and SSA does not publish race at all and offers a microsimulation instead. Read across the rows and one comparison holds: the means-tested programmes track the poverty population, and the age-based programmes track the older population, which is whiter than the country.
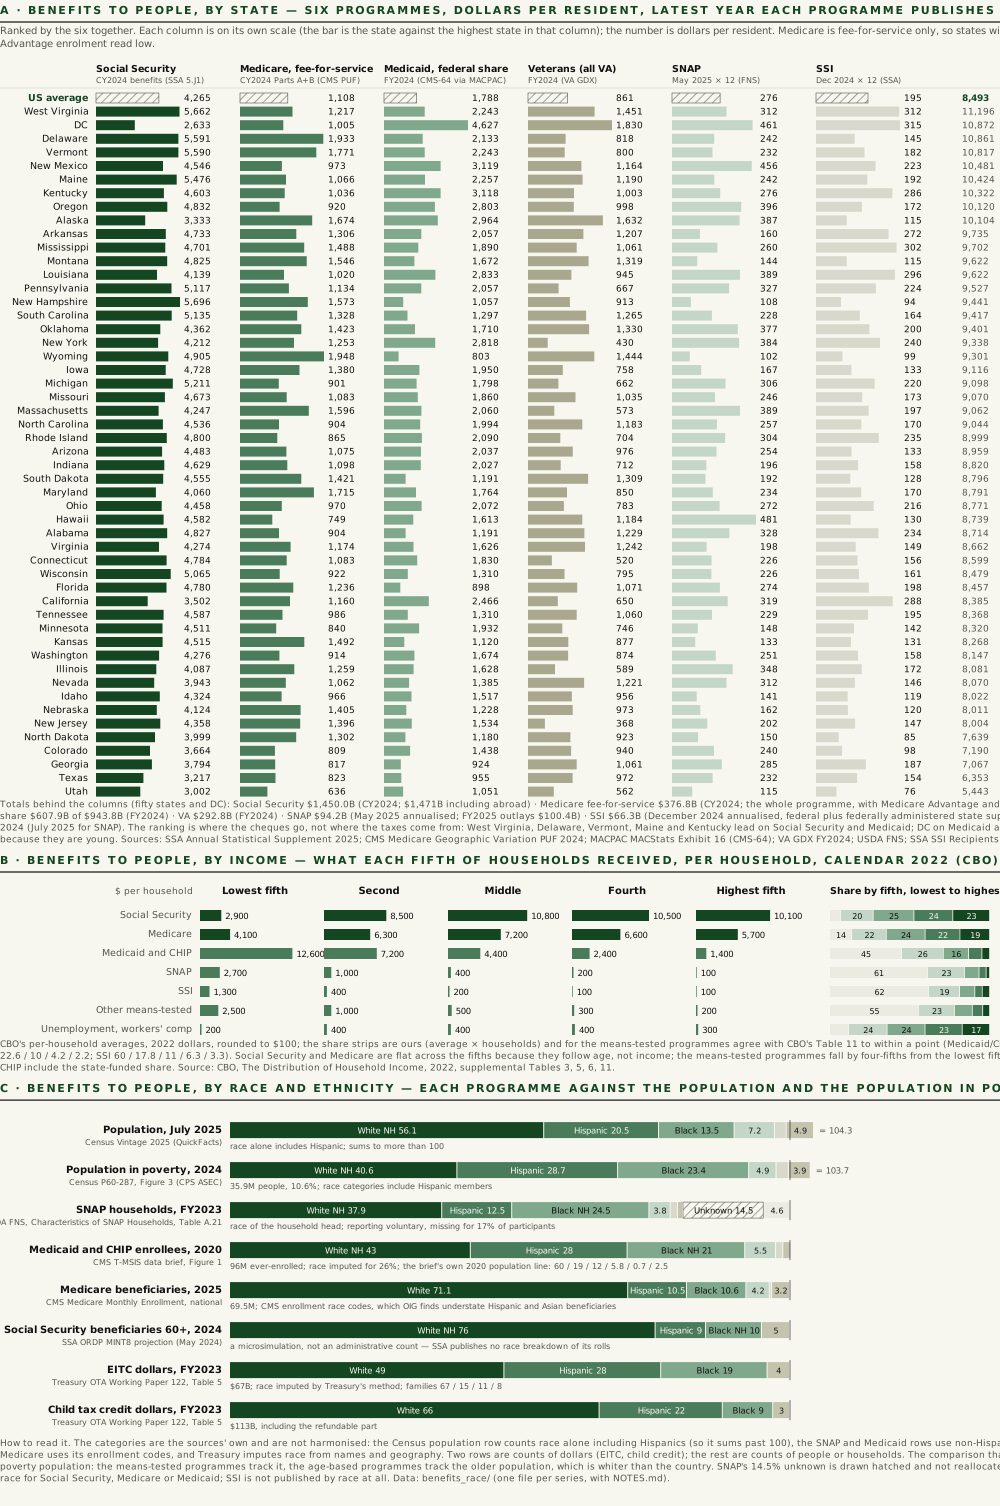
GDX_FY24.xlsx, direct and indirect expenditures by state); USDA FNS, SNAP state-level participation and benefits, May 2025; SSA, SSI Recipients by State and County, 2024, Tables 1 and 2; Census Bureau Vintage 2025 state population estimates. Panel B: CBO, The Distribution of Household Income, 2022, supplemental Tables 3, 5, 6 and 11. Panel C: Census QuickFacts, Vintage 2025 population by race and Hispanic origin; Census P60-287, Poverty in the United States: 2024, Figure 3 (verified against the rendered page); USDA FNS, Characteristics of SNAP Households: Fiscal Year 2023, Table A.21; CMS, Race and ethnicity of the national Medicaid and CHIP population in 2020, Figure 1; CMS Medicare Monthly Enrollment, national, 2025; SSA ORDP, MINT8 projection of beneficiaries aged 60 and over by race and ethnicity (May 2024); Treasury Office of Tax Analysis, Working Paper 122, Table 5. Method. Panel A divides each programme’s state total by the state’s July 2024 population (July 2025 for SNAP); monthly series are multiplied by twelve and say so; Medicare is fee-for-service only, so it understates states where Medicare Advantage is large; VA includes medical care, education and construction as well as compensation; each column’s bars are scaled to that column’s maximum. Panel B is CBO’s per-household averages; the share strips are households times average and are checked against CBO’s own Table 11 in the note. Panel C draws each row at its published percentages on a common 100 per cent width, so rows whose categories overlap run past the line and say so; the SNAP unknown is drawn hatched and not reallocated; no row is harmonised to another. Data: benefits_geo/benefits_per_resident_by_state.csv and the nine source files behind it; benefits_race/, one file per series, each with its universe, period and categories recorded.XIV. The ledger, left to right
Part One drew the flow twice — three columns in Plate XI, four in Plate XII — and both were allocations after the first column. This plate draws it in six columns and makes four of the six exact. The left column is the money in, on the bridge Plate XII built: the seventeen receipt lines of the Monthly Treasury Statement, the collections and receipts the budget nets out, the year’s borrowing, and the $623 billion of reimbursable and revolving-fund activity that USAspending’s account file counts and OMB does not, so that all five columns sum to the same $9,811.5B. From there every band is a cross-tabulation of the same 57,474 rows: the eighteen budget functions, the nine kinds of thing the money bought, the forty-four accounts of $28 billion or more with the remainder of each kind gathered beneath them, then seven classes of recipient assigned account by account, and, at the far right, those seven broken into fifty: which programme paid the household, which grant reached the state, which function paid the contractor, which service or agency paid the employee, whether the interest went to the public or to the government’s own funds, which tax was refunded. A glossary beneath the plate defines every item in every column. The reading is the reading of the whole study, but here it can be followed with a finger. Payroll taxes go by law to Social Security and Medicare and are drawn dark; the income tax and the borrowing have no destination until the ordering gives them one, and the plate says so. Three functions — Medicare, Social Security and Health — are $4.6 trillion and almost all of it is benefits and grants; defense is the only function whose money is mostly people, contracts and equipment; interest is one function, one kind, one account, one recipient. And at the far right the $9.8 trillion resolves into $3.7 trillion to individuals and households, $1.5 trillion to states, localities and nonprofits, $1.4 trillion to businesses, $0.7 trillion to the government’s own employees and retirees, $1.3 trillion to the holders of its debt, $0.4 trillion back to taxpayers as refunds, and $0.9 trillion that never left the government at all.
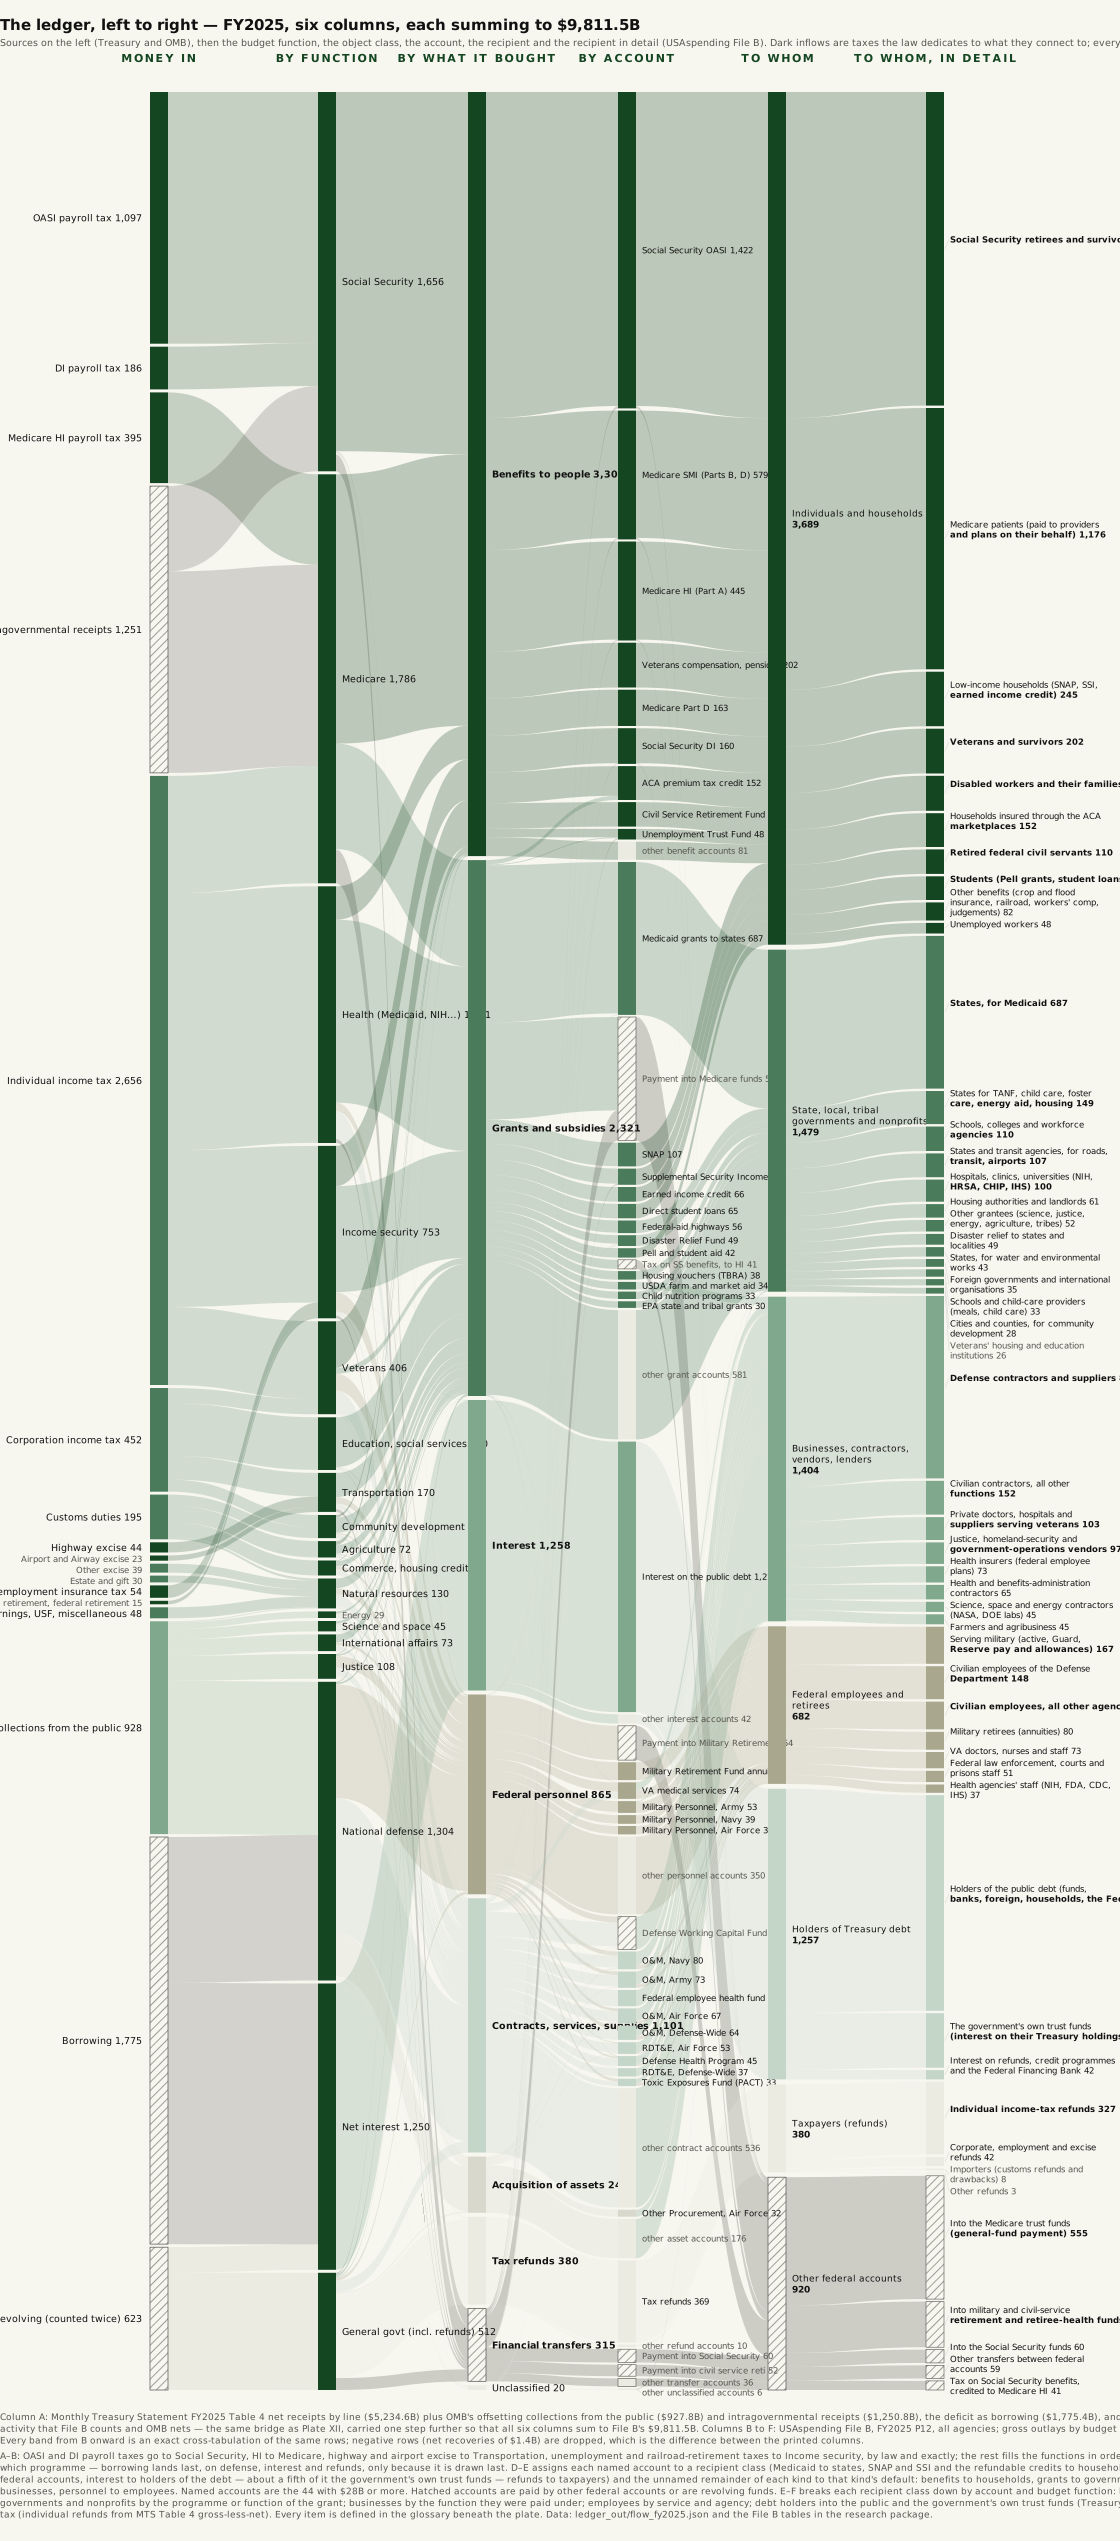
Interactive edition. Plate XVII is also published as a clickable web version — every bar and ribbon opens its definition, amount, sources and where the money comes from and goes, with a state-by-state section on what each state gets per resident: Interactive Map of Federal Dollars. Part Three follows the money into the states and across twelve years: Federal Dollars by State, Over Time.
What each item in Plate XVII is
One line per item, column by column, so the plate can be read without the budget’s vocabulary. Dollar figures are on the plate; these are definitions.
Column A — Money in
- OASI payroll tax
- The 10.6-point share of the 12.4% Social Security payroll tax (split between employer and employee, on wages up to $176,100) that funds Old-Age and Survivors Insurance — retirement and survivor benefits.
- DI payroll tax
- The 1.8-point share of the Social Security payroll tax that funds Disability Insurance.
- Medicare HI payroll tax
- The 2.9% Medicare Hospital Insurance tax on all wages, no cap (plus the 0.9% surtax on high earners); funds Medicare Part A.
- Intragovernmental receipts
- Money one federal account receives from another — interest the Treasury pays its own trust funds, agency contributions to retirement and health funds, the general fund’s payments into Medicare. Counted at both ends at the gross level, hence hatched.
- Individual income tax
- Tax on individuals’ income, net of refunds: $1,919B withheld from paychecks, $1,064B paid with returns and estimates, less $327B refunded.
- Corporation income tax
- Tax on corporate profits (Form 1120), net of refunds.
- Customs duties
- Tariffs collected by Customs and Border Protection at the border, net of refunds; $90.5B of the year’s $195B came from the IEEPA tariffs later struck down.
- Highway excise
- Federal taxes on gasoline, diesel, heavy trucks and tyres, dedicated by law to the Highway Trust Fund.
- Airport and Airway excise
- Taxes on airline tickets, cargo and aviation fuel, dedicated to the Airport and Airway Trust Fund.
- Other excise
- Taxes on alcohol, tobacco, health insurers, stock buybacks, telephones, firearms and other goods that go to the general fund.
- Estate and gift
- Taxes on large estates at death and on large lifetime gifts.
- Unemployment insurance tax
- Federal (FUTA) and state unemployment taxes on employers, deposited in the Unemployment Trust Fund.
- Railroad retirement, federal retirement
- Payroll taxes of railroad workers and employees’ contributions to federal retirement, dedicated to those funds.
- Fed earnings, USF, miscellaneous
- Federal Reserve remittances, Universal Service Fund charges on phone bills, fees, fines and other miscellaneous receipts.
- Offsetting collections from the public
- Money the public pays that the budget counts as negative spending rather than revenue — Medicare premiums, postal and power sales, park and passport fees, loan repayments. Netted out of the $7.0T outlay total; put back here.
- Borrowing
- The deficit: what the Treasury borrowed by selling bills, notes and bonds to cover spending that receipts did not.
- Reimbursable and revolving (counted twice)
- Work one agency does for another and sales by revolving funds such as the Defense Working Capital Fund; File B records them as outlays, OMB nets them out. Included so the columns balance; hatched because the money is counted twice.
Column B — By budget function
- Social Security
- Retirement, survivor and disability benefits and their administration (function 650).
- Medicare
- Hospital, medical and drug coverage for people 65+ and the disabled (function 570).
- Health (Medicaid, NIH, ACA…)
- Medicaid and CHIP grants, the ACA premium credit, NIH research, FDA, CDC, Indian Health, health workforce (function 550).
- Income security
- SNAP, SSI, refundable credits, unemployment, housing assistance, TANF, child care, foster care, federal and military retirement (function 600).
- Veterans
- Compensation, pensions, GI Bill, VA health care (function 700).
- Education, training, social services
- K-12 and higher-education grants, student aid, job training, social services (function 500).
- Transportation
- Highways, transit, aviation, rail, maritime (function 400).
- Community development
- Disaster relief, community development grants, rural and urban development (function 450).
- Agriculture
- Farm supports, crop insurance, research and marketing (function 350).
- Commerce, housing credit
- Housing programmes, mortgage insurance, deposit insurance, Postal Service, commerce (function 370).
- Natural resources
- Water projects, conservation, EPA, parks and public lands (function 300).
- Energy
- Energy supply, research and conservation (function 270).
- Science and space
- NASA, NSF and general science (function 250).
- International affairs
- Foreign aid, diplomacy, security assistance (function 150).
- Justice
- FBI, prisons, courts, border and immigration enforcement, law-enforcement grants (function 750).
- National defense
- Military pay, operations, procurement, research, construction and the Defense Department’s retirement accruals (function 050).
- Net interest
- Interest on the public debt and other federal interest (function 900).
- General government (incl. refunds)
- Tax refunds, the IRS, central administration, payments to territories (function 800).
Column C — By what it bought (object class)
- Benefits to people
- Object class 42, insurance claims and indemnities: cheques and claims paid to or on behalf of people — Social Security, Medicare, veterans’ compensation, retirement annuities, unemployment.
- Grants and subsidies
- Object class 41: payments to states, localities, institutions and individuals under a grant or subsidy programme — Medicaid, SNAP, SSI, refundable credits, highways, student aid — and, by the budget’s coding, the general fund’s payment into the Medicare trust funds.
- Interest
- Object class 43: interest on the public debt and other interest payments.
- Federal personnel
- Object classes 11–13: pay, civilian benefits and benefits for former personnel (retirement annuities and accruals).
- Contracts, services, supplies
- Object classes 21–26: travel, transport, utilities, printing, services bought from non-federal sources, supplies and materials.
- Acquisition of assets
- Object classes 31–33: equipment, land and structures, investments and loans.
- Tax refunds
- Object class 44: refunds of taxes and duties.
- Financial transfers
- Object class 94: payments from one federal account into another.
- Unclassified
- Rows with no valid object class in the agency’s submission.
Column D — By account (the 44 accounts of $28B or more)
- Social Security OASI
- Federal Old-Age and Survivors Insurance Trust Fund — retirement and survivor benefits.
- Medicare SMI (Parts B, D)
- Supplementary Medical Insurance Trust Fund — doctor visits, outpatient care and the drug benefit; gross of premiums.
- Medicare HI (Part A)
- Hospital Insurance Trust Fund — inpatient hospital, skilled nursing, hospice.
- Veterans compensation, pensions
- Disability compensation and needs-based pensions paid by the Veterans Benefits Administration.
- Medicare Part D
- The prescription-drug account within Medicare.
- Social Security DI
- Disability Insurance Trust Fund — benefits to disabled workers and their families.
- ACA premium tax credit
- The refundable credit that pays part of the premium for marketplace health plans.
- Civil Service Retirement Fund
- Annuities to retired federal civilian employees and survivors (CSRS and FERS).
- Unemployment Trust Fund
- State unemployment benefits paid through the federal trust fund.
- Medicaid grants to states
- The federal share of Medicaid, paid to state programmes.
- Payment into Medicare funds
- The general fund’s statutory contribution to the SMI and Part D accounts — hatched, intragovernmental.
- SNAP
- Supplemental Nutrition Assistance Program benefits (food stamps).
- Supplemental Security Income
- Cash assistance to aged, blind and disabled people with little income.
- Earned income credit (refundable)
- The part of the EITC paid out in excess of tax owed.
- Direct student loans
- Net outlays of the federal direct student loan programme, including re-estimates.
- Federal-aid highways
- Grants to states from the Highway Trust Fund.
- Pell and student aid
- Pell Grants and campus-based aid.
- Tax on SS benefits, to HI
- Income tax collected on Social Security benefits and credited to the Medicare HI fund — hatched, intragovernmental.
- Housing vouchers (TBRA)
- Tenant-based rental assistance (Section 8 vouchers) paid through housing authorities.
- Disaster Relief Fund
- FEMA’s fund for declared disasters.
- USDA farm and market aid
- The Processing, Research and Marketing account, the 2025 vehicle for farm assistance.
- Child nutrition programs
- School lunch, breakfast and child-care meals.
- EPA state and tribal grants
- Water infrastructure and environmental grants.
- Child tax credit (refundable)
- The refundable part of the child tax credit.
- Interest on the public debt
- Interest paid on all Treasury securities, held by the public and by federal trust funds.
- Payment into Military Retirement Fund
- Defense’s accrual payment for future military retirement — hatched, intragovernmental.
- Military Retirement Fund (annuities)
- Retired pay to military retirees and survivors.
- Military Personnel, Army / Navy / Air Force
- Pay and allowances of serving members.
- VA medical services
- Pay of VA doctors, nurses and staff, and medical supplies and services.
- Defense Working Capital Fund
- The revolving fund the services buy supplies, depot maintenance and logistics from — hatched, counted twice.
- Concurrent-receipt accrual, MRF
- Treasury’s payment into the Military Retirement Fund for concurrent receipt of retired pay and disability compensation — hatched.
- O&M, Navy / Army / Air Force / Defense-Wide
- Operation and maintenance: training, fuel, repairs, base operations, civilian pay of the services.
- RDT&E, Air Force / Navy / Defense-Wide
- Research, development, test and evaluation of weapons and systems.
- Defense Health Program
- TRICARE and military hospitals.
- Toxic Exposures Fund (PACT)
- VA fund for care and benefits related to toxic exposures (PACT Act).
- Federal employee health benefits fund
- Premiums paid to private carriers for federal employees’ and retirees’ health insurance.
- GSA Acquisition Services Fund
- Revolving fund through which agencies buy goods, vehicles and IT — hatched, counted twice.
- Other Procurement, Air Force; Shipbuilding and Conversion, Navy; Aircraft Procurement
- Purchases of aircraft, ships, missiles, vehicles and equipment.
- Tax refunds
- Refunding Internal Revenue Collections — refunds of income, corporate, employment and excise taxes.
- Payment into Social Security funds; Payment into civil service retirement; Payment into DoD retiree health fund
- General-fund payments into the respective trust funds — hatched, intragovernmental.
- other … accounts
- Every account below $28B in that kind, gathered into one bar.
Column E — To whom
- Individuals and households
- Money paid to people or on their behalf: benefits, cash credits, food and cash assistance, student aid, unemployment insurance.
- State, local, tribal governments and nonprofits
- Grants to governments and institutions, which then spend them on programmes and providers.
- Businesses, contractors, vendors, lenders
- Contracts, purchases, insurance premiums, farm payments and revolving-fund sales.
- Federal employees and retirees
- Pay, allowances and benefits of serving military and civilian employees, and annuities to retirees.
- Holders of Treasury debt
- Everyone the Treasury pays interest to — mutual funds, banks, foreign governments, households, the Federal Reserve, and the government’s own trust funds.
- Taxpayers (refunds)
- Refunds of taxes and duties overpaid or over-withheld.
- Other federal accounts
- Transfers that never leave the government: payments into trust and retirement funds and the tax credited to Medicare.
Column F — To whom, in detail
- Social Security retirees and survivors
- OASI benefits to retired workers, their spouses and dependants, and survivors of deceased workers.
- Medicare patients (paid to providers and plans on their behalf)
- Medicare pays hospitals, doctors, plans and pharmacies for care delivered to enrollees; the money is the patient’s benefit even though the cheque goes to the provider.
- Low-income households (SNAP, SSI, earned income credit)
- Means-tested cash and food assistance to households with low income.
- Veterans and survivors
- Disability compensation, pensions and dependency payments.
- Disabled workers and their families
- Social Security Disability Insurance.
- Households insured through the ACA marketplaces
- The premium tax credit paid to insurers on behalf of enrolled households.
- Retired federal civil servants
- CSRS and FERS annuities.
- Students (Pell grants, student loans)
- Grants and net loan outlays to students and their colleges.
- Other benefits
- Crop and flood insurance claims, railroad retirement, workers’ compensation, court judgements and similar.
- Unemployed workers
- Unemployment insurance benefits paid through the states.
- States, for Medicaid
- The federal share of each state’s Medicaid programme.
- States for TANF, child care, foster care, energy aid, housing
- Income-security grants that states administer.
- Schools, colleges and workforce agencies
- Title I, special education, higher-education and job-training grants.
- States and transit agencies, for roads, transit, airports
- Highway, transit, airport and rail grants.
- Hospitals, clinics, universities (NIH, HRSA, CHIP, IHS)
- Research and health-services grants and CHIP.
- Housing authorities and landlords
- Vouchers, project-based assistance, public housing and community planning grants.
- Other grantees
- Science, justice, energy, agriculture, tribal and general-government grants.
- Disaster relief to states and localities
- FEMA assistance after declared disasters.
- States, for water and environmental works
- EPA and conservation grants.
- Foreign governments and international organisations
- Economic and security assistance, disaster and health aid abroad.
- Schools and child-care providers (meals, child care)
- Child nutrition reimbursements.
- Cities and counties, for community development
- Community development and rural grants.
- Veterans’ housing and education institutions
- GI Bill payments to schools and housing benefit programmes.
- Defense contractors and suppliers
- Everything the Defense Department buys from the private sector: weapons, ships, aircraft, fuel, services, depot work, health care.
- Civilian contractors, all other functions
- Services and supplies bought by civilian agencies not listed separately.
- Private doctors, hospitals and suppliers serving veterans
- VA community care and medical purchases.
- Justice, homeland-security and government-operations vendors
- Detention, security, IT and facilities contracts.
- Health insurers (federal employee plans)
- Premiums for federal employee and retiree health plans.
- Health and benefits-administration contractors
- Medicare administrative contractors, Social Security and health-agency vendors.
- Farmers and agribusiness
- Farm aid, crop insurance operations and agricultural purchases.
- Science, space and energy contractors (NASA, DOE labs)
- NASA missions and the national laboratories, which are contractor-run.
- Serving military (active, Guard, Reserve pay and allowances)
- Basic pay, housing and subsistence allowances, bonuses.
- Civilian employees of the Defense Department
- Pay and benefits of the roughly 750,000 civilians in the Defense workforce.
- Civilian employees, all other agencies
- Pay and benefits outside Defense, VA, Justice and health.
- Military retirees (annuities)
- Retired pay from the Military Retirement Fund.
- VA doctors, nurses and staff
- VA’s own medical and administrative workforce.
- Federal law enforcement, courts and prisons staff
- FBI, marshals, prisons, immigration and border staff.
- Health agencies’ staff (NIH, FDA, CDC, IHS)
- Employees of the health agencies.
- Holders of the public debt
- Interest on Treasury securities held outside the government — mutual funds, banks, insurers, pensions, foreign holders, households and the Federal Reserve (whose share comes back as remittances).
- The government’s own trust funds
- Interest credited on the Treasury securities held by Social Security, Medicare, military and civil-service retirement and other trust funds — about a fifth of all interest.
- Interest on refunds, credit programmes and the Federal Financing Bank
- Interest paid on late refunds, on uninvested credit-programme balances, and by the FFB.
- Individual income-tax refunds
- Refunds of over-withheld and overpaid individual income tax.
- Corporate, employment and excise refunds
- Refunds of other IRS-collected taxes.
- Importers (customs refunds and drawbacks)
- Refunds of duties, including duties paid on goods later exported.
- Into the Medicare trust funds (general-fund payment)
- The Treasury’s statutory contribution to Part B and Part D.
- Into military and civil-service retirement and retiree-health funds
- Accrual payments and Treasury contributions to the retirement and retiree-health funds.
- Into the Social Security funds
- General-fund payments to the Social Security funds (including the tax on benefits credited to OASDI).
- Tax on Social Security benefits, credited to Medicare HI
- The income tax on benefits above the second threshold, credited to the HI fund.
- Other transfers between federal accounts
- The annuitants’ health-benefit payment, the airport trust fund’s transfer, railroad and other small transfers.
What the ledger says
Turn the money four ways and the same shape appears each time. Out: the government is a payer of benefits and a maker of grants first, a borrower’s creditor second, an employer and a buyer a distant third, and an owner of things last — $244 billion of assets in $9.8 trillion. In: the income tax is paid by the top, the payroll tax by the middle, and the two together make a system whose average rate climbs from one per cent to thirty-one across the distribution and whose largest single component, the payroll tax, is the one the bottom three fifths actually pay. Back: the age-based programmes go everywhere and to everyone in proportion to age, and the income-based programmes go where the poverty is — which is the bottom two fifths, the old states of the East and the South, and, on every source’s categories, disproportionately to Black and Hispanic households, in about the proportion that they are disproportionately poor.
What we could not verify
- Minor object class by account is a gross, reimbursable-inclusive basis. File B’s $9,811.5B does not reconcile to OMB’s $9,188.6B or to the $7,010.0B net total, and the plate says so; the difference is revolving-fund and reimbursable activity that the budget nets. Interest on the public debt includes the interest credited to trust funds and is not split here.
- The IRS state table attributes collections to the filing address, not to residence or incidence; the DC, Nebraska, Delaware and South Dakota figures are artefacts of that and are labelled. The Rockefeller residence-based allocation in Part One is the corrective.
- Medicare by state is fee-for-service only ($376.8B of a roughly $1.0T programme); CMS does not publish Medicare Advantage or Part D payments by state in a form that could be fetched. VA’s FY2024 workbook is the latest edition; its Wisconsin, Wyoming and Puerto Rico rows came from the workbook, not the report pages that could not be read.
- Race and ethnicity. No federal source publishes benefit dollars by race for Social Security, Medicare or Medicaid, and SSI is not published by race at all; the plate uses recipient counts, an SSA microsimulation and Treasury’s imputed dollars for the credits, and says which is which. Medicaid’s primary CMS figure is 2020 with 26 per cent of race imputed; a 2023 secondary series exists (KFF, from the same T-MSIS source, 13 per cent unknown) and is in the research package but not charted. SNAP’s table is the race of the household head, missing for 14.5 per cent of households. The Census poverty distribution was re-read from the rendered page of the report after a text-layer extraction proved ambiguous.
- Plate XVII’s first column is an allocation except where the law dedicates a tax, and its last column is an assignment by account; both are described on the plate and neither is a claim about causation. The five columns sum to File B’s $9,811.5B, which is reconciled to OMB’s $9,188.6B by a $622.9B reimbursable-and-revolving band drawn hatched.
- Population denominators are Census Vintage 2025 as mirrored by FRED and cross-checked against Census pages for fourteen states, because the Census file itself refuses automated retrieval.
- Years differ by source and are printed on every panel: FY2025 for outlays and IRS collections; calendar 2022 for CBO; calendar 2024 for Social Security, Medicare and the poverty distribution; FY2024 for Medicaid and VA; May 2025 for SNAP; December 2024 for SSI; 2020 for Medicaid race; FY2023 for SNAP race and the credits.
Sources
The consolidated source list for both parts is published as Study V — SourcesThe Distribution of Household Income, 2022; SSA Annual Statistical Supplement 2025 and SSI state report 2024; CMS Medicare Geographic Variation PUF, Medicare Monthly Enrollment and the 2020 T-MSIS race brief; MACPAC MACStats Exhibit 16 (CMS-64); VA GDX FY2024; USDA FNS SNAP data tables and the FY2023 characteristics report; Census Vintage 2025 population estimates and P60-287; SSA ORDP MINT8 projection; Treasury OTA Working Paper 122.
Read next
- Every Federal Dollar
- Every Federal Dollar, Mapped
- Every Dollar of War Defense, veterans and the world since 1940, per resident and in fiscal 2025 dollars, and what it bought.
Next: Study V · Part Three, Federal Dollars by State, Over Time