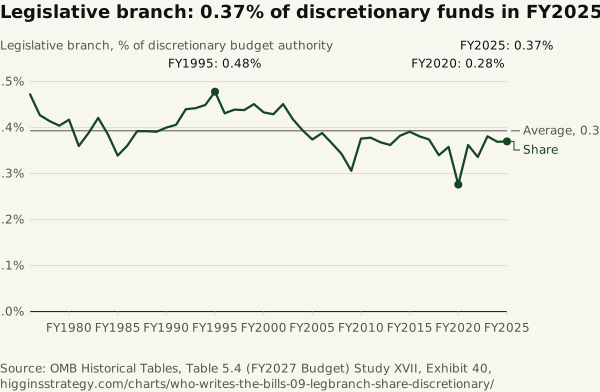
Legislative branch: 0.37% of discretionary funds in FY2025
Source. OMB Historical Tables, Table 5.4 (FY2027 Budget)
Method and data
Method. The transition quarter is excluded, and OMB estimates for FY2026 and later are not used. The computed means are 0.393% for FY1976–FY2025 and 0.360% for FY2006–FY2025; CRS reports about 0.40% since FY1976 and 0.36% for FY2006–FY2026. The share depends on the total as well as on the branch: from FY2019 to FY2020 legislative branch budget authority rose 6.1% ($4,934 million to $5,235 million) and total discretionary rose 37.9% ($1.377 trillion to $1.899 trillion), which produced the FY2020 low (0.28%); from FY2008 to FY2009 the branch rose 12.9% and the total 26.5%. The table carries no note on the cause of either change.
| Fiscal year | Legislative branch BA ($ millions) | Total discretionary BA ($ millions) | Share (%) |
|---|---|---|---|
| 1976 | 934 | 197,766 | 0.472 |
| 1977 | 1,055 | 246,819 | 0.427 |
| 1978 | 1,077 | 259,940 | 0.414 |
| 1979 | 1,114 | 276,016 | 0.404 |
| 1980 | 1,297 | 311,237 | 0.417 |
| 1981 | 1,226 | 340,959 | 0.36 |
| 1982 | 1,379 | 355,567 | 0.388 |
| 1983 | 1,634 | 388,278 | 0.421 |
| 1984 | 1,629 | 423,645 | 0.385 |
| 1985 | 1,550 | 456,592 | 0.339 |
| 1986 | 1,580 | 437,903 | 0.361 |
| 1987 | 1,748 | 445,764 | 0.392 |
| 1988 | 1,776 | 453,251 | 0.392 |
| 1989 | 1,840 | 471,081 | 0.391 |
| 1990 | 1,987 | 496,704 | 0.4 |
| 1991 | 2,218 | 546,099 | 0.406 |
| 1992 | 2,337 | 531,392 | 0.44 |
| 1993 | 2,313 | 523,297 | 0.442 |
| 1994 | 2,302 | 512,592 | 0.449 |
| 1995 | 2,395 | 501,422 | 0.478 |
| 1996 | 2,158 | 500,959 | 0.431 |
| 1997 | 2,246 | 511,208 | 0.439 |
| 1998 | 2,320 | 529,636 | 0.438 |
| 1999 | 2,626 | 581,839 | 0.451 |
| 2000 | 2,531 | 584,348 | 0.433 |
| 2001 | 2,849 | 663,820 | 0.429 |
| 2002 | 3,311 | 734,780 | 0.451 |
| 2003 | 3,553 | 849,448 | 0.418 |
| 2004 | 3,580 | 908,454 | 0.394 |
| 2005 | 3,689 | 987,504 | 0.374 |
| 2006 | 3,865 | 996,694 | 0.388 |
| 2007 | 3,920 | 1,072,278 | 0.366 |
| 2008 | 4,047 | 1,179,648 | 0.343 |
| 2009 | 4,571 | 1,492,028 | 0.306 |
| 2010 | 4,754 | 1,264,258 | 0.376 |
| 2011 | 4,609 | 1,220,714 | 0.378 |
| 2012 | 4,407 | 1,197,635 | 0.368 |
| 2013 | 4,127 | 1,140,220 | 0.362 |
| 2014 | 4,334 | 1,133,696 | 0.382 |
| 2015 | 4,369 | 1,116,667 | 0.391 |
| 2016 | 4,440 | 1,166,707 | 0.381 |
| 2017 | 4,563 | 1,219,987 | 0.374 |
| 2018 | 4,835 | 1,422,828 | 0.34 |
| 2019 | 4,934 | 1,376,542 | 0.358 |
| 2020 | 5,235 | 1,898,880 | 0.276 |
| 2021 | 5,856 | 1,617,959 | 0.362 |
| 2022 | 6,006 | 1,788,485 | 0.336 |
| 2023 | 7,011 | 1,837,947 | 0.381 |
| 2024 | 6,855 | 1,857,585 | 0.369 |
| 2025 | 6,854 | 1,854,495 | 0.37 |
Download who-writes-the-bills-09-legbranch-share-discretionary.csv