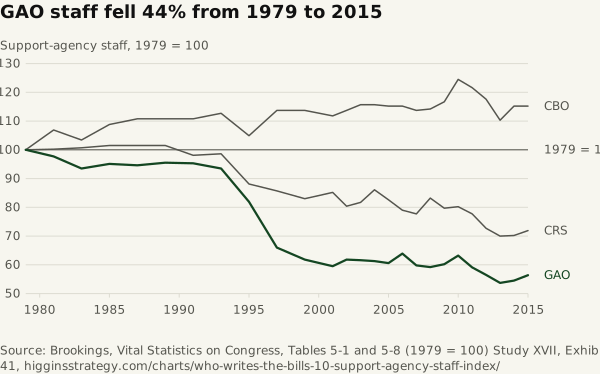
GAO staff fell 44% from 1979 to 2015
Source. Brookings, Vital Statistics on Congress, Tables 5-1 and 5-8 (1979 = 100)
Method and data
Method. Brookings’ tables end in 2015. The 2006 values come from Table 5-8, which prints 3,388 for GAO, in line with 2005 (3,215) and 2007 (3,172); Table 5-1 prints 2,388 for GAO in 2006 and a subtotal that adds with it, and the discrepancy is unexplained. OTA is omitted because it closed after FY1995. GAO’s own counts of 3,556 full-time equivalents in FY2025, 3,353 in FY2026 and 3,210 requested for FY2027 are a different measure from Brookings’ 2015 figure of 2,989 and are not joined to this series.
| Year | GAO staff | CRS staff | CBO staff | GAO (1979 = 100) | CRS (1979 = 100) | CBO (1979 = 100) | Note |
|---|---|---|---|---|---|---|---|
| 1979 | 5,303 | 847 | 204 | 100 | 100 | 100 | |
| 1981 | 5,182 | 849 | 218 | 97.7 | 100.2 | 106.9 | |
| 1983 | 4,960 | 853 | 211 | 93.5 | 100.7 | 103.4 | |
| 1985 | 5,042 | 860 | 222 | 95.1 | 101.5 | 108.8 | |
| 1987 | 5,016 | 860 | 226 | 94.6 | 101.5 | 110.8 | |
| 1989 | 5,063 | 860 | 226 | 95.5 | 101.5 | 110.8 | |
| 1991 | 5,054 | 831 | 226 | 95.3 | 98.1 | 110.8 | |
| 1993 | 4,958 | 835 | 230 | 93.5 | 98.6 | 112.7 | |
| 1995 | 4,342 | 746 | 214 | 81.9 | 88.1 | 104.9 | |
| 1997 | 3,500 | 726 | 232 | 66 | 85.7 | 113.7 | |
| 1999 | 3,275 | 703 | 232 | 61.8 | 83 | 113.7 | |
| 2001 | 3,155 | 722 | 228 | 59.5 | 85.2 | 111.8 | |
| 2002 | 3,275 | 681 | 232 | 61.8 | 80.4 | 113.7 | |
| 2003 | 3,269 | 692 | 236 | 61.6 | 81.7 | 115.7 | |
| 2004 | 3,252 | 729 | 236 | 61.3 | 86.1 | 115.7 | |
| 2005 | 3,215 | 700 | 235 | 60.6 | 82.6 | 115.2 | |
| 2006 | 3,388 | 669 | 235 | 63.9 | 79 | 115.2 | GAO 2006: Table 5-8 prints 3,388; Table 5-1 prints 2,388 |
| 2007 | 3,172 | 658 | 232 | 59.8 | 77.7 | 113.7 | |
| 2008 | 3,137 | 705 | 233 | 59.2 | 83.2 | 114.2 | |
| 2009 | 3,191 | 675 | 238 | 60.2 | 79.7 | 116.7 | |
| 2010 | 3,350 | 679 | 254 | 63.2 | 80.2 | 124.5 | |
| 2011 | 3,134 | 658 | 248 | 59.1 | 77.7 | 121.6 | |
| 2012 | 2,997 | 616 | 240 | 56.5 | 72.7 | 117.6 | |
| 2013 | 2,849 | 593 | 225 | 53.7 | 70 | 110.3 | |
| 2014 | 2,891 | 595 | 235 | 54.5 | 70.2 | 115.2 | |
| 2015 | 2,989 | 609 | 235 | 56.4 | 71.9 | 115.2 |
Download who-writes-the-bills-10-support-agency-staff-index.csv