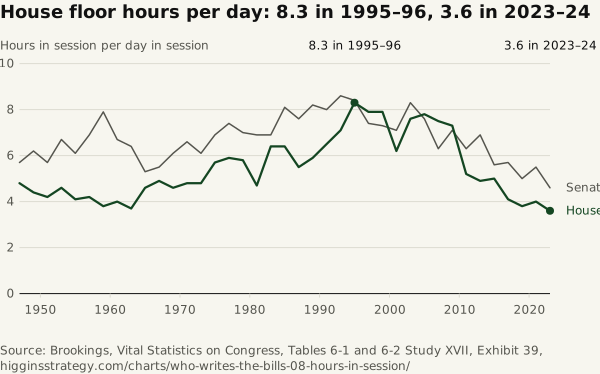
House floor hours per day: 8.3 in 1995–96, 3.6 in 2023–24
Source. Brookings, Vital Statistics on Congress, Tables 6-1 and 6-2
Method and data
Method. Hours per day are hours divided by days. For the 104th Congress that gives 8.3 for the House (2,445 hours over 296 days), the value printed in the Chapter 6 PDF. Brookings’ separate 6-1.csv file prints 8.4 for that row and differs from the PDF in eight other House rows; the CSV holds both. House days are calendar days in session (Table 6-1 note f), and the notes do not say whether pro forma sessions count.
| Congress | Years | House days | House hours | House hours per day | Senate days | Senate hours | Senate hours per day | House hours per day (6-1.csv) |
|---|---|---|---|---|---|---|---|---|
| 80 | 1947-1948 | 254 | 1,224 | 4.8 | 257 | 1,462 | 5.7 | 4.8 |
| 81 | 1949-1950 | 341 | 1,501 | 4.4 | 389 | 2,410 | 6.2 | 4.4 |
| 82 | 1951-1952 | 274 | 1,163 | 4.2 | 287 | 1,648 | 5.7 | 4.2 |
| 83 | 1953-1954 | 226 | 1,033 | 4.6 | 294 | 1,962 | 6.7 | 4.3 |
| 84 | 1955-1956 | 228 | 937 | 4.1 | 224 | 1,362 | 6.1 | 4.1 |
| 85 | 1957-1958 | 276 | 1,148 | 4.2 | 271 | 1,876 | 6.9 | 4.2 |
| 86 | 1959-1960 | 271 | 1,039 | 3.8 | 280 | 2,199 | 7.9 | 3.9 |
| 87 | 1961-1962 | 305 | 1,227 | 4 | 323 | 2,164 | 6.7 | 4 |
| 88 | 1963-1964 | 334 | 1,251 | 3.7 | 375 | 2,395 | 6.4 | 3.7 |
| 89 | 1965-1966 | 337 | 1,548 | 4.6 | 345 | 1,814 | 5.3 | 4.6 |
| 90 | 1967-1968 | 326 | 1,595 | 4.9 | 358 | 1,961 | 5.5 | 4.9 |
| 91 | 1969-1971 | 349 | 1,613 | 4.6 | 384 | 2,352 | 6.1 | 4.6 |
| 92 | 1971-1972 | 298 | 1,429 | 4.8 | 348 | 2,295 | 6.6 | 4.8 |
| 93 | 1973-1974 | 334 | 1,603 | 4.8 | 352 | 2,152 | 6.1 | 4.8 |
| 94 | 1975-1976 | 311 | 1,788 | 5.7 | 320 | 2,210 | 6.9 | 5.7 |
| 95 | 1977-1978 | 324 | 1,898 | 5.9 | 337 | 2,510 | 7.4 | 5.9 |
| 96 | 1979-1980 | 326 | 1,876 | 5.8 | 333 | 2,324 | 7 | 5.8 |
| 97 | 1981-1982 | 305 | 1,420 | 4.7 | 312 | 2,160 | 6.9 | 4.7 |
| 98 | 1983-1984 | 267 | 1,705 | 6.4 | 281 | 1,951 | 6.9 | 6.4 |
| 99 | 1985-1986 | 282 | 1,794 | 6.4 | 313 | 2,531 | 8.1 | 6.4 |
| 100 | 1987-1988 | 299 | 1,659 | 5.5 | 307 | 2,342 | 7.6 | 5.6 |
| 101 | 1989-1990 | 288 | 1,688 | 5.9 | 274 | 2,254 | 8.2 | 6 |
| 102 | 1991-1992 | 278 | 1,796 | 6.5 | 287 | 2,292 | 8 | 6.5 |
| 103 | 1993-1994 | 266 | 1,887 | 7.1 | 291 | 2,514 | 8.6 | 7.1 |
| 104 | 1995-1996 | 296 | 2,445 | 8.3 | 343 | 2,876 | 8.4 | 8.4 |
| 105 | 1997-1998 | 252 | 2,002 | 7.9 | 296 | 2,188 | 7.4 | 8 |
| 106 | 1999-2000 | 276 | 2,179 | 7.9 | 303 | 2,202 | 7.3 | 8 |
| 107 | 2001-2002 | 272 | 1,694 | 6.2 | 322 | 2,280 | 7.1 | 6.4 |
| 108 | 2003-2004 | 248 | 1,894 | 7.6 | 300 | 2,486 | 8.3 | 7.8 |
| 109 | 2005-2006 | 247 | 1,918 | 7.8 | 297 | 2,250 | 7.6 | 7.8 |
| 110 | 2007-2008 | 286 | 2,138 | 7.5 | 374 | 2,364 | 6.3 | 7.5 |
| 111 | 2009-2010 | 290 | 2,127 | 7.3 | 349 | 2,495 | 7.1 | 7.3 |
| 112 | 2011-2012 | 330 | 1,718 | 5.2 | 323 | 2,032 | 6.3 | 5.2 |
| 113 | 2013-2014 | 298 | 1,472 | 4.9 | 292 | 2,003 | 6.9 | 4.9 |
| 114 | 2015-2016 | 288 | 1,438 | 5 | 333 | 1,855 | 5.6 | 5 |
| 115 | 2017-2018 | 368 | 1,517 | 4.1 | 386 | 2,182 | 5.7 | 4.1 |
| 116 | 2019-2020 | 357 | 1,353 | 3.8 | 379 | 1,912 | 5 | 3.8 |
| 117 | 2021-2022 | 336 | 1,330 | 4 | 370 | 2,042 | 5.5 | 4 |
| 118 | 2023-2024 | 350 | 1,253 | 3.6 | 354 | 1,641 | 4.6 | 3.6 |