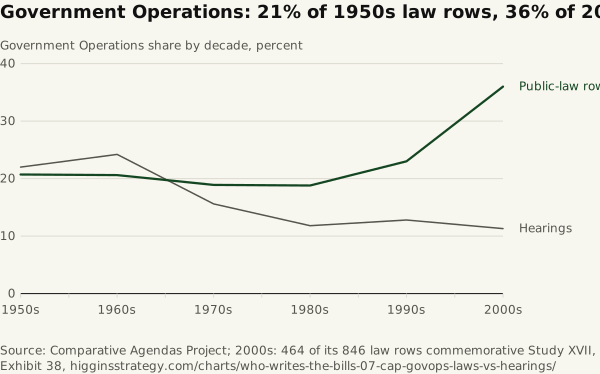
Government Operations: 21% of 1950s law rows, 36% of 2000s
Source. Comparative Agendas Project; 2000s: 464 of its 846 law rows commemorative
Method and data
Method. Decades are plotted at their first year. Hearings come from CAP’s U.S. Congressional Hearings dataset. CAP has one row per public law: its rows equal Brookings’ count of public laws in 17 of the 21 Congresses from the 94th to the 114th (none differs by more than 3) and are 98% of the count in the 82nd–86th. They are used for shares only, and CAP’s hearing counts and Brookings’ meeting counts are separate series that are not compared. Of the 846 Government Operations law rows in the 2000s, CAP flags 464 as commemorative, 19.7% of that decade’s 2,352 rows.
| Decade | Government Operations hearings | All hearings | Hearing share (%) | Government Operations law rows | All law rows | Law-row share (%) | Government Operations law rows flagged commemorative |
|---|---|---|---|---|---|---|---|
| 1950s | 2,534 | 11,523 | 22 | 848 | 4,105 | 20.7 | 52 |
| 1960s | 2,332 | 9,640 | 24.2 | 738 | 3,587 | 20.6 | 93 |
| 1970s | 2,417 | 15,496 | 15.6 | 598 | 3,162 | 18.9 | 122 |
| 1980s | 2,118 | 17,973 | 11.8 | 591 | 3,136 | 18.8 | 296 |
| 1990s | 2,070 | 16,135 | 12.8 | 544 | 2,361 | 23 | 244 |
| 2000s | 1,734 | 15,354 | 11.3 | 846 | 2,352 | 36 | 464 |
Download who-writes-the-bills-07-cap-govops-laws-vs-hearings.csv