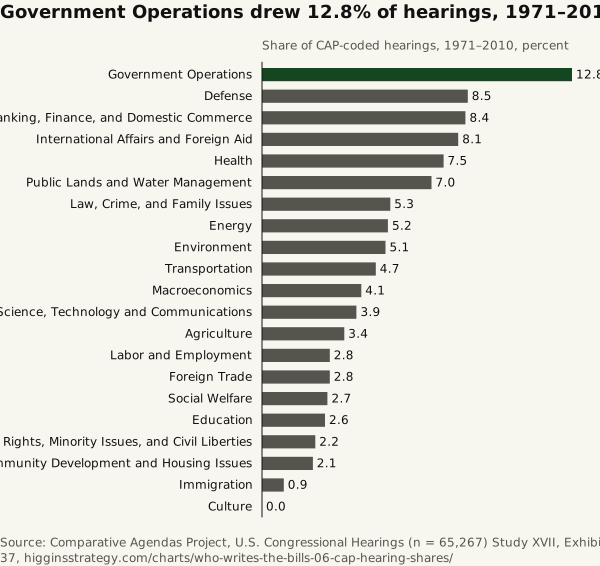
Government Operations drew 12.8% of hearings, 1971–2010
Source. Comparative Agendas Project, U.S. Congressional Hearings (n = 65,267)
Method and data
Method. Each share divides a topic’s hearings by all 65,267 hearings dated 1971–2010. Topic names follow the CAP topics codebook; the CSV also holds the shorter names on CAP’s current master codebook page.
| Topic | Hearings | Share (%) | CAP master codebook name |
|---|---|---|---|
| Government Operations | 8,339 | 12.8 | Government Operations |
| Defense | 5,558 | 8.5 | Defense |
| Banking, Finance, and Domestic Commerce | 5,484 | 8.4 | Domestic Commerce |
| International Affairs and Foreign Aid | 5,300 | 8.1 | International Affairs |
| Health | 4,869 | 7.5 | Health |
| Public Lands and Water Management | 4,590 | 7 | Public Lands |
| Law, Crime, and Family Issues | 3,468 | 5.3 | Law and Crime |
| Energy | 3,369 | 5.2 | Energy |
| Environment | 3,341 | 5.1 | Environment |
| Transportation | 3,048 | 4.7 | Transportation |
| Macroeconomics | 2,675 | 4.1 | Macroeconomics |
| Space, Science, Technology and Communications | 2,523 | 3.9 | Technology |
| Agriculture | 2,208 | 3.4 | Agriculture |
| Labor and Employment | 1,851 | 2.8 | Labor |
| Foreign Trade | 1,810 | 2.8 | Foreign Trade |
| Social Welfare | 1,735 | 2.7 | Social Welfare |
| Education | 1,727 | 2.6 | Education |
| Civil Rights, Minority Issues, and Civil Liberties | 1,424 | 2.2 | Civil Rights |
| Community Development and Housing Issues | 1,388 | 2.1 | Housing |
| Immigration | 556 | 0.9 | Immigration |
| Culture | 4 | 0 | Culture |