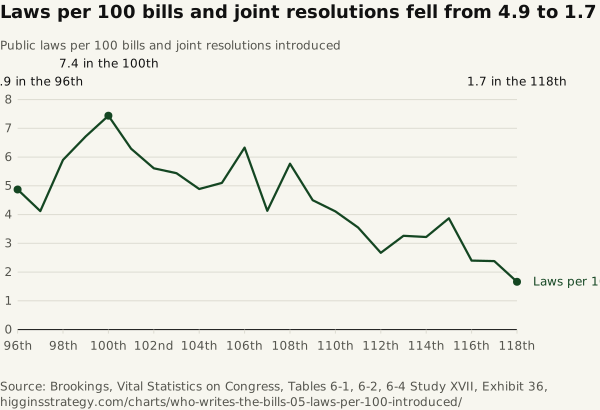
Laws per 100 bills and joint resolutions fell from 4.9 to 1.7
Source. Brookings, Vital Statistics on Congress, Tables 6-1, 6-2, 6-4
Method and data
Method. Introductions are House and Senate bills and joint resolutions. The chart and the text start at the 96th Congress because the House limited cosponsors from 1967 to 1979; the CSV also holds the 80th–95th, where the ratio reached 8.39 in the 80th. Brookings and CRS 96-727 differ by no more than 4 introductions in the 80th–108th Congresses except the 101st, where they differ by 19.
| Congress | Years | Introduced, total | Public laws | Laws per 100 introduced | Introduced, CRS 96-727 |
|---|---|---|---|---|---|
| 80 | 1947-1948 | 10,797 | 906 | 8.39 | 10,797 |
| 81 | 1949-1950 | 14,988 | 921 | 6.14 | 14,988 |
| 82 | 1951-1952 | 12,730 | 594 | 4.67 | 12,730 |
| 83 | 1953-1954 | 14,952 | 781 | 5.22 | 14,952 |
| 84 | 1955-1956 | 17,687 | 1,028 | 5.81 | 17,687 |
| 85 | 1957-1958 | 19,112 | 936 | 4.9 | 19,112 |
| 86 | 1959-1960 | 18,261 | 800 | 4.38 | 18,261 |
| 87 | 1961-1962 | 18,376 | 885 | 4.82 | 18,376 |
| 88 | 1963-1964 | 17,479 | 666 | 3.81 | 17,479 |
| 89 | 1965-1966 | 24,003 | 810 | 3.37 | 24,003 |
| 90 | 1967-1968 | 26,460 | 640 | 2.42 | 26,460 |
| 91 | 1969-1971 | 26,303 | 695 | 2.64 | 26,303 |
| 92 | 1971-1972 | 22,969 | 607 | 2.64 | 22,969 |
| 93 | 1973-1974 | 23,396 | 649 | 2.77 | 23,396 |
| 94 | 1975-1976 | 21,097 | 588 | 2.79 | 21,096 |
| 95 | 1977-1978 | 19,387 | 634 | 3.27 | 19,387 |
| 96 | 1979-1980 | 12,583 | 613 | 4.87 | 12,583 |
| 97 | 1981-1982 | 11,490 | 473 | 4.12 | 11,490 |
| 98 | 1983-1984 | 10,559 | 623 | 5.9 | 10,559 |
| 99 | 1985-1986 | 9,885 | 664 | 6.72 | 9,885 |
| 100 | 1987-1988 | 9,588 | 713 | 7.44 | 9,588 |
| 101 | 1989-1990 | 10,333 | 650 | 6.29 | 10,352 |
| 102 | 1991-1992 | 10,513 | 590 | 5.61 | 10,513 |
| 103 | 1993-1994 | 8,544 | 465 | 5.44 | 8,544 |
| 104 | 1995-1996 | 6,808 | 333 | 4.89 | 6,808 |
| 105 | 1997-1998 | 7,732 | 394 | 5.1 | 7,730 |
| 106 | 1999-2000 | 9,158 | 580 | 6.33 | 9,158 |
| 107 | 2001-2002 | 9,134 | 377 | 4.13 | 9,130 |
| 108 | 2003-2004 | 8,625 | 498 | 5.77 | 8,621 |
| 109 | 2005-2006 | 10,703 | 482 | 4.5 | |
| 110 | 2007-2008 | 11,179 | 460 | 4.11 | |
| 111 | 2009-2010 | 10,778 | 383 | 3.55 | |
| 112 | 2011-2012 | 10,612 | 283 | 2.67 | |
| 113 | 2013-2014 | 9,068 | 296 | 3.26 | |
| 114 | 2015-2016 | 10,223 | 329 | 3.22 | |
| 115 | 2017-2018 | 11,416 | 442 | 3.87 | |
| 116 | 2019-2020 | 14,342 | 344 | 2.4 | |
| 117 | 2021-2022 | 15,234 | 362 | 2.38 | |
| 118 | 2023-2024 | 16,554 | 274 | 1.66 |
Download who-writes-the-bills-05-laws-per-100-introduced.csv