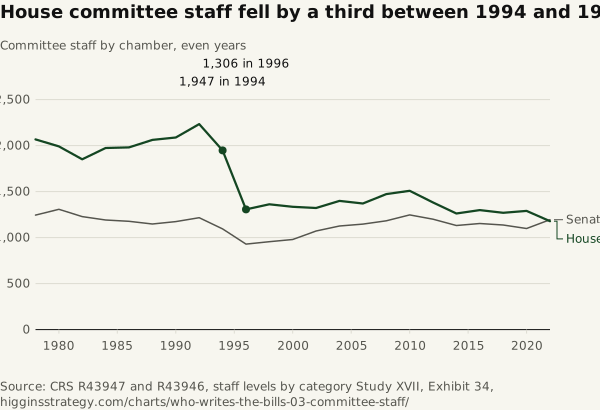
House committee staff fell by a third between 1994 and 1996
Source. CRS R43947 and R43946, staff levels by category
Method and data
Method. Counts are CRS analysis of chamber telephone directories; Senate counts come from R43946. House counts for 1977–2019 come from printed directories, where staff listed more than once can be counted more than once; counts for 2020–2023 come from the online directory, which counts them once, so the series mixes two methods. The chart shows even years and ends in 2022 (House 1,178); the 2023 figure in the text is 1,170. Senate figures for 2019 and 2021 are blank in the CRS source. Brookings Table 5-5 is a different series with the same 1995 break. Through 1986 it counts only the statutory and investigative staff of standing committees (some staff as half a position), for 2006–2009 it includes select committees, and it marks 2007 and 2009 as under review. For 1980 to 2014 it gives 1,917 to 1,134 (59%) against CRS 1,991 to 1,262 (63%); Table 5-1, which includes select committee staff, gives 2,027 (1979) to 1,163 (57%). None reaches half.
| Year | House committee staff | Senate committee staff | House committee share of chamber staff (%) | Senate committee share of chamber staff (%) | House counting method |
|---|---|---|---|---|---|
| 1978 | 2,067 | 1,244 | 22.7 | printed directory; staff listed more than once can be counted more than once | |
| 1980 | 1,991 | 1,307 | 21.3 | printed directory; staff listed more than once can be counted more than once | |
| 1982 | 1,851 | 1,228 | 20 | printed directory; staff listed more than once can be counted more than once | |
| 1984 | 1,974 | 1,191 | 20.7 | printed directory; staff listed more than once can be counted more than once | |
| 1986 | 1,980 | 1,177 | 21 | printed directory; staff listed more than once can be counted more than once | |
| 1988 | 2,062 | 1,147 | 21.7 | 23.2 | printed directory; staff listed more than once can be counted more than once |
| 1990 | 2,088 | 1,174 | 22.1 | 23 | printed directory; staff listed more than once can be counted more than once |
| 1992 | 2,233 | 1,216 | 22.7 | 22.3 | printed directory; staff listed more than once can be counted more than once |
| 1994 | 1,947 | 1,094 | 19.7 | 20 | printed directory; staff listed more than once can be counted more than once |
| 1996 | 1,306 | 929 | 15 | 17.8 | printed directory; staff listed more than once can be counted more than once |
| 1998 | 1,361 | 955 | 14.7 | 18.1 | printed directory; staff listed more than once can be counted more than once |
| 2000 | 1,334 | 979 | 14.8 | 18.7 | printed directory; staff listed more than once can be counted more than once |
| 2002 | 1,321 | 1,071 | 14.1 | 19.9 | printed directory; staff listed more than once can be counted more than once |
| 2004 | 1,399 | 1,126 | 14.6 | 19.8 | printed directory; staff listed more than once can be counted more than once |
| 2006 | 1,370 | 1,146 | 14.3 | 19.3 | printed directory; staff listed more than once can be counted more than once |
| 2008 | 1,472 | 1,182 | 14.7 | 19.9 | printed directory; staff listed more than once can be counted more than once |
| 2010 | 1,508 | 1,246 | 15.3 | 20.2 | printed directory; staff listed more than once can be counted more than once |
| 2012 | 1,381 | 1,200 | 13.9 | 20.1 | printed directory; staff listed more than once can be counted more than once |
| 2014 | 1,262 | 1,131 | 13.8 | 19.6 | printed directory; staff listed more than once can be counted more than once |
| 2016 | 1,298 | 1,153 | 13.8 | 20.1 | printed directory; staff listed more than once can be counted more than once |
| 2018 | 1,269 | 1,137 | 13.9 | 19.7 | printed directory; staff listed more than once can be counted more than once |
| 2020 | 1,290 | 1,099 | 14.2 | 19.2 | online directory; staff listed more than once counted once (CRS R43947 note 4) |
| 2022 | 1,178 | 1,194 | 12.9 | 19.8 | online directory; staff listed more than once counted once (CRS R43947 note 4) |