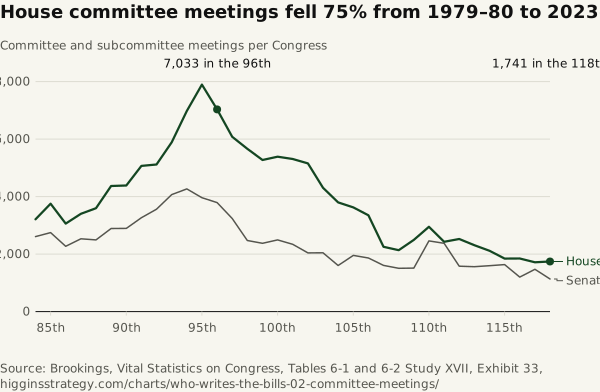
House committee meetings fell 75% from 1979–80 to 2023–24
Source. Brookings, Vital Statistics on Congress, Tables 6-1 and 6-2
Method and data
Method. Meetings are as counted by Brookings. House counts for the 84th–88th Congresses omit the Appropriations Committee (Table 6-1 note c). Only the Senate table’s note c says its figure includes all hearings and business meetings (Table 6-2); the House table does not define a meeting. House meetings per panel step down at the 107th Congress, from 30.2 to 19.4, and Brookings does not say whether counting rules changed. The Senate fell 70% over the same period (3,790 to 1,134).
| Congress | Years | House meetings | Senate meetings | Total meetings |
|---|---|---|---|---|
| 84 | 1955-1956 | 3,210 | 2,607 | 5,817 |
| 85 | 1957-1958 | 3,750 | 2,748 | 6,498 |
| 86 | 1959-1960 | 3,059 | 2,271 | 5,330 |
| 87 | 1961-1962 | 3,402 | 2,532 | 5,934 |
| 88 | 1963-1964 | 3,596 | 2,493 | 6,089 |
| 89 | 1965-1966 | 4,367 | 2,889 | 7,256 |
| 90 | 1967-1968 | 4,386 | 2,892 | 7,278 |
| 91 | 1969-1971 | 5,066 | 3,264 | 8,330 |
| 92 | 1971-1972 | 5,114 | 3,559 | 8,673 |
| 93 | 1973-1974 | 5,888 | 4,067 | 9,955 |
| 94 | 1975-1976 | 6,975 | 4,265 | 11,240 |
| 95 | 1977-1978 | 7,896 | 3,960 | 11,856 |
| 96 | 1979-1980 | 7,033 | 3,790 | 10,823 |
| 97 | 1981-1982 | 6,078 | 3,236 | 9,314 |
| 98 | 1983-1984 | 5,661 | 2,471 | 8,132 |
| 99 | 1985-1986 | 5,272 | 2,373 | 7,645 |
| 100 | 1987-1988 | 5,388 | 2,493 | 7,881 |
| 101 | 1989-1990 | 5,305 | 2,340 | 7,645 |
| 102 | 1991-1992 | 5,152 | 2,039 | 7,191 |
| 103 | 1993-1994 | 4,304 | 2,043 | 6,347 |
| 104 | 1995-1996 | 3,796 | 1,601 | 5,397 |
| 105 | 1997-1998 | 3,624 | 1,954 | 5,578 |
| 106 | 1999-2000 | 3,347 | 1,862 | 5,209 |
| 107 | 2001-2002 | 2,254 | 1,605 | 3,859 |
| 108 | 2003-2004 | 2,135 | 1,506 | 3,641 |
| 109 | 2005-2006 | 2,492 | 1,513 | 4,005 |
| 110 | 2007-2008 | 2,949 | 2,458 | 5,407 |
| 111 | 2009-2010 | 2,426 | 2,374 | 4,800 |
| 112 | 2011-2012 | 2,524 | 1,577 | 4,101 |
| 113 | 2013-2014 | 2,307 | 1,559 | 3,866 |
| 114 | 2015-2016 | 2,112 | 1,595 | 3,707 |
| 115 | 2017-2018 | 1,841 | 1,633 | 3,474 |
| 116 | 2019-2020 | 1,845 | 1,200 | 3,045 |
| 117 | 2021-2022 | 1,714 | 1,470 | 3,184 |
| 118 | 2023-2024 | 1,741 | 1,134 | 2,875 |