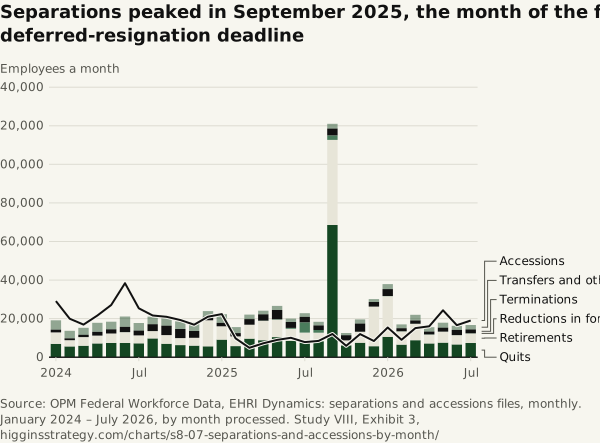
Separations peaked in September 2025, the month of the first deferred-resignation deadline
Source. OPM Federal Workforce Data, EHRI Dynamics: separations and accessions files, monthly. January 2024 – July 2026, by month processed.
Method and data
Method. Separations by personnel-action category in the month the action was processed: quits; retirements (voluntary, early-out and other); reductions in force; terminations; transfers out, other separations and deaths. The five bars sum to the month’s separations. Deferred resignations are not a sixth kind: OPM flags them (drp_indicator) across the kinds — mostly quits and retirements — so they are a column of their own, “of which”, and are never added to the bars. Accessions (new hires and transfers in) are the line, on the same scale. Mean pay is annualized basic pay of leavers whose pay OPM publishes.
| Month | Separations | Quits | Retirements | Reductions in force | Terminations | Transfers and other | Of which deferred resignation | Accessions |
|---|---|---|---|---|---|---|---|---|
| January 2024 | 19,115 | 6,958 | 5,883 | 0 | 1,494 | 4,780 | 0 | 29,098 |
| February 2024 | 13,675 | 5,580 | 3,245 | 0 | 981 | 3,869 | 0 | 19,951 |
| March 2024 | 15,232 | 5,970 | 4,427 | 0 | 1,290 | 3,545 | 0 | 16,914 |
| April 2024 | 17,813 | 7,169 | 4,039 | 1 | 1,949 | 4,655 | 0 | 21,603 |
| May 2024 | 18,405 | 7,426 | 4,864 | 1 | 2,177 | 3,937 | 0 | 27,082 |
| June 2024 | 21,100 | 7,386 | 5,592 | 14 | 2,783 | 5,325 | 0 | 38,348 |
| July 2024 | 17,727 | 7,202 | 4,093 | 1 | 2,572 | 3,859 | 0 | 25,339 |
| August 2024 | 21,052 | 9,734 | 3,816 | 1 | 3,555 | 3,946 | 0 | 21,609 |
| September 2024 | 20,318 | 7,005 | 4,468 | 10 | 4,923 | 3,912 | 0 | 20,941 |
| October 2024 | 18,604 | 6,281 | 3,634 | 4 | 4,698 | 3,987 | 0 | 19,297 |
| November 2024 | 17,978 | 6,023 | 4,041 | 2 | 3,531 | 4,381 | 0 | 16,867 |
| December 2024 | 23,927 | 5,635 | 13,509 | 12 | 1,875 | 2,896 | 0 | 21,001 |
| January 2025 | 22,271 | 9,133 | 6,871 | 1 | 1,854 | 4,412 | 6 | 22,325 |
| February 2025 | 15,620 | 5,771 | 5,004 | 1 | 1,727 | 3,117 | 30 | 9,746 |
| March 2025 | 22,084 | 9,661 | 7,161 | 24 | 2,919 | 2,319 | 134 | 4,889 |
| April 2025 | 24,135 | 8,838 | 9,954 | 177 | 3,276 | 1,890 | 152 | 7,193 |
| May 2025 | 26,616 | 10,402 | 9,067 | 253 | 4,741 | 2,153 | 411 | 8,953 |
| June 2025 | 20,029 | 8,537 | 6,166 | 502 | 3,051 | 1,773 | 469 | 10,070 |
| July 2025 | 22,825 | 7,803 | 4,978 | 5,325 | 2,853 | 1,866 | 480 | 7,841 |
| August 2025 | 18,377 | 8,304 | 4,425 | 1,376 | 2,386 | 1,886 | 974 | 8,469 |
| September 2025 | 121,014 | 68,533 | 44,120 | 2,342 | 3,605 | 2,414 | 96,401 | 12,017 |
| October 2025 | 12,526 | 6,177 | 2,537 | 11 | 2,702 | 1,099 | 1,948 | 5,902 |
| November 2025 | 19,584 | 7,505 | 5,629 | 89 | 4,263 | 2,098 | 3,638 | 11,976 |
| December 2025 | 30,139 | 5,702 | 20,517 | 35 | 2,356 | 1,529 | 15,480 | 8,381 |
| January 2026 | 37,883 | 10,591 | 21,046 | 109 | 3,544 | 2,593 | 13,584 | 15,423 |
| February 2026 | 16,988 | 6,522 | 6,794 | 144 | 1,563 | 1,965 | 3,367 | 8,997 |
| March 2026 | 21,991 | 8,831 | 8,378 | 137 | 1,734 | 2,911 | 2,536 | 15,100 |
| April 2026 | 15,571 | 7,142 | 4,534 | 134 | 1,535 | 2,226 | 522 | 16,021 |
| May 2026 | 17,872 | 7,572 | 5,575 | 124 | 2,069 | 2,532 | 143 | 24,325 |
| June 2026 | 16,299 | 6,647 | 4,757 | 72 | 2,669 | 2,154 | 81 | 16,610 |
| July 2026 | 16,681 | 7,387 | 4,907 | 120 | 1,995 | 2,272 | 125 | 19,024 |
Download SVG · CSV. Data and chart licensed CC BY 4.0.
Higgins Strategy. “Separations peaked in September 2025, the month of the first deferred-resignation deadline” Exhibit 3, Every Federal Job (Study VIII). October 12, 2026. https://higginsstrategy.com/charts/s8-07-separations-and-accessions-by-month/