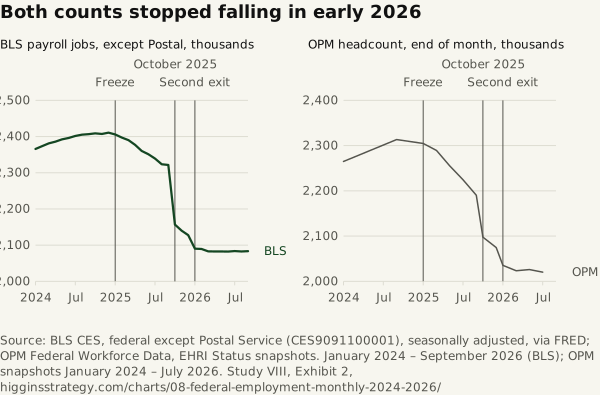
Both counts stopped falling in early 2026
Source. BLS CES, federal except Postal Service (CES9091100001), seasonally adjusted, via FRED; OPM Federal Workforce Data, EHRI Status snapshots. January 2024 – September 2026 (BLS); OPM snapshots January 2024 – July 2026.
Method and data
Method. BLS: payroll jobs, federal except Postal Service, seasonally adjusted, thousands. OPM: headcount of executive-branch civilian employees in the status snapshot on the last day of each month, for the months whose files were retrieved. The two series differ in coverage — the CES includes the legislative and judicial branches and some agencies OPM’s file does not carry — so they are drawn as two panels, each on its own scale, sharing the months. Some Department of War components did not submit June and July 2026 data, so OPM’s June and July counts are incomplete.
| Month | BLS, except Postal (thousands) | BLS, all federal (thousands) | OPM headcount |
|---|---|---|---|
| January 2024 | 2,365.7 | 2,971 | 2,264,960 |
| February 2024 | 2,373.3 | 2,980 | |
| March 2024 | 2,381 | 2,989 | |
| April 2024 | 2,385.7 | 2,992 | |
| May 2024 | 2,392.1 | 3,001 | |
| June 2024 | 2,396 | 3,005 | |
| July 2024 | 2,401.5 | 3,007 | |
| August 2024 | 2,405 | 3,011 | |
| September 2024 | 2,406.6 | 3,012 | 2,313,216 |
| October 2024 | 2,408.7 | 3,013 | |
| November 2024 | 2,407 | 3,009 | |
| December 2024 | 2,410.8 | 3,009 | |
| January 2025 | 2,405.7 | 3,010 | 2,304,585 |
| February 2025 | 2,397.1 | 2,997 | |
| March 2025 | 2,390 | 2,988 | 2,289,192 |
| April 2025 | 2,376.9 | 2,976 | |
| May 2025 | 2,360.2 | 2,952 | 2,255,056 |
| June 2025 | 2,351 | 2,944 | |
| July 2025 | 2,339.2 | 2,935 | 2,224,444 |
| August 2025 | 2,323.5 | 2,916 | |
| September 2025 | 2,321.5 | 2,914 | 2,190,219 |
| October 2025 | 2,156.8 | 2,748 | 2,097,534 |
| November 2025 | 2,140 | 2,733 | |
| December 2025 | 2,127.6 | 2,722 | 2,074,649 |
| January 2026 | 2,090.3 | 2,685 | 2,035,344 |
| February 2026 | 2,089.4 | 2,689 | |
| March 2026 | 2,082.7 | 2,682 | 2,023,318 |
| April 2026 | 2,082.5 | 2,681 | |
| May 2026 | 2,082.6 | 2,685 | 2,025,993 |
| June 2026 | 2,082.3 | 2,685 | |
| July 2026 | 2,083.5 | 2,686 | 2,020,230 |
| August 2026 | 2,082.6 | 2,683 | |
| September 2026 | 2,083.3 | 2,682 |
Download SVG · CSV. Data and chart licensed CC BY 4.0.
Higgins Strategy. “Both counts stopped falling in early 2026” Exhibit 2, Every Federal Job (Study VIII). October 12, 2026. https://higginsstrategy.com/charts/08-federal-employment-monthly-2024-2026/