Every department and agency with 500 or more employees shrank
Source. OPM Federal Workforce Data, EHRI Status snapshots (record counts). January 2020 – July 2026; compared January 2025 to May 2026.
Method and data
Method. Every department and agency with 500 or more employees in January 2025 (the last full snapshot before the change of administration), sorted by the percentage change to May 2026 — the last month before a change in the Defense Department’s reporting left some of its components missing from the June and July 2026 files. The Government Printing Office leaves the file after September 2025, a coverage change rather than separations; it is blank, not zero, and is not drawn. All agencies together: 2,304,585 to 2,025,993, −12.1%.
| Department or agency | Jan 2025 | May 2026 | Change | % change |
|---|---|---|---|---|
| Government Printing Office | 1,640 | |||
| USAID | 4,969 | 236 | −4,733 | −95.3 |
| Education | 4,111 | 2,272 | −1,839 | −44.7 |
| AmeriCorps (CNCS) | 714 | 399 | −315 | −44.1 |
| Small Business Administration | 8,562 | 5,097 | −3,465 | −40.5 |
| General Services Administration | 13,367 | 8,323 | −5,044 | −37.7 |
| Peace Corps | 987 | 618 | −369 | −37.4 |
| Federal Reserve System | 1,748 | 1,098 | −650 | −37.2 |
| Office of Personnel Management | 3,055 | 1,977 | −1,078 | −35.3 |
| National Science Foundation | 1,699 | 1,111 | −588 | −34.6 |
| Federal Housing Finance Agency | 883 | 600 | −283 | −32 |
| U.S. Agency for Global Media | 1,186 | 813 | −373 | −31.5 |
| Housing and Urban Development | 8,375 | 5,867 | −2,508 | −29.9 |
| Treasury | 116,709 | 84,302 | −32,407 | −27.8 |
| Development Finance Corporation | 717 | 531 | −186 | −25.9 |
| Environmental Protection Agency | 16,931 | 12,557 | −4,374 | −25.8 |
| National Credit Union Administration | 1,226 | 931 | −295 | −24.1 |
| Energy | 17,592 | 13,363 | −4,229 | −24 |
| Office of Management and Budget | 678 | 515 | −163 | −24 |
| FDIC | 6,548 | 5,046 | −1,502 | −22.9 |
| Pension Benefit Guaranty Corporation | 966 | 745 | −221 | −22.9 |
| NASA | 18,078 | 13,962 | −4,116 | −22.8 |
| Labor | 14,237 | 11,029 | −3,208 | −22.5 |
| Health and Human Services | 93,397 | 73,186 | −20,211 | −21.6 |
| State | 14,478 | 11,370 | −3,108 | −21.5 |
| Federal Communications Commission | 1,488 | 1,191 | −297 | −20 |
| Federal Trade Commission | 1,278 | 1,026 | −252 | −19.7 |
| EEOC | 2,075 | 1,678 | −397 | −19.1 |
| Commodity Futures Trading Commission | 699 | 567 | −132 | −18.9 |
| National Archives | 2,888 | 2,358 | −530 | −18.4 |
| Securities and Exchange Commission | 4,812 | 3,941 | −871 | −18.1 |
| Consumer Product Safety Commission | 512 | 421 | −91 | −17.8 |
| Commerce | 48,803 | 40,829 | −7,974 | −16.3 |
| National Labor Relations Board | 1,248 | 1,044 | −204 | −16.3 |
| Nuclear Regulatory Commission | 2,926 | 2,457 | −469 | −16 |
| Agriculture | 90,314 | 77,478 | −12,836 | −14.2 |
| Social Security Administration | 57,384 | 49,536 | −7,848 | −13.7 |
| Court Services and Offender Supervision (DC) | 1,035 | 902 | −133 | −12.9 |
| Railroad Retirement Board | 781 | 689 | −92 | −11.8 |
| Defense | 774,572 | 684,904 | −89,668 | −11.6 |
| Justice | 116,718 | 106,310 | −10,408 | −8.9 |
| Transportation | 57,423 | 52,721 | −4,702 | −8.2 |
| Smithsonian Institution | 4,450 | 4,100 | −350 | −7.9 |
| Interior | 63,774 | 58,884 | −4,890 | −7.7 |
| Veterans Affairs | 479,003 | 445,660 | −33,343 | −7 |
| Homeland Security | 231,795 | 225,578 | −6,217 | −2.7 |
Download SVG · CSV. Data and chart licensed CC BY 4.0.
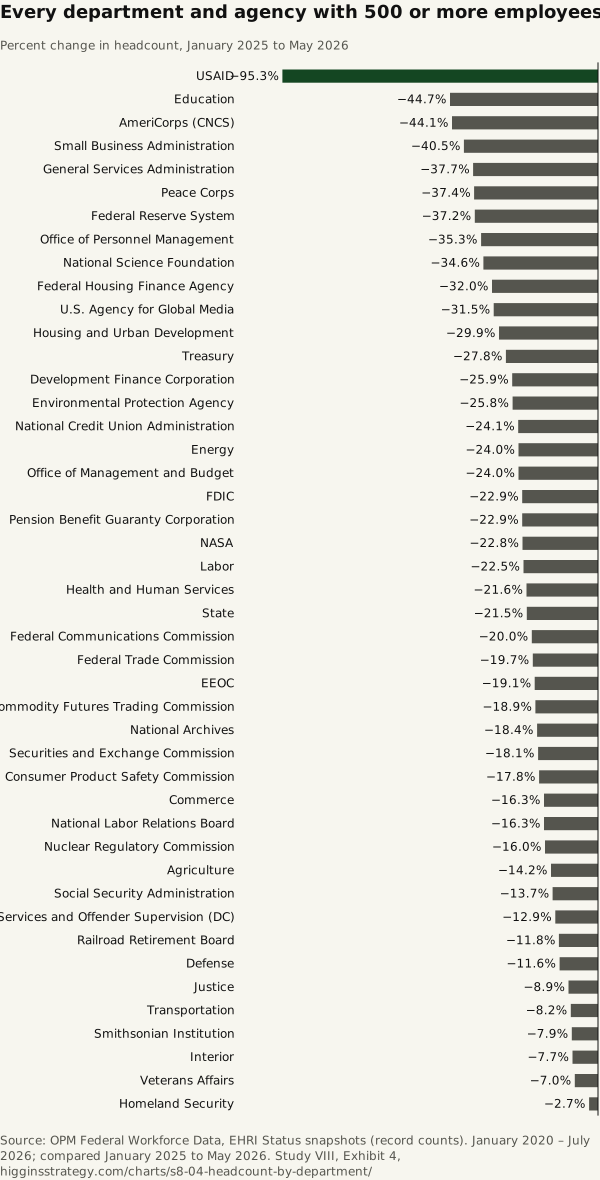
Higgins Strategy. “Every department and agency with 500 or more employees shrank” Exhibit 4, Every Federal Job (Study VIII). October 12, 2026. https://higginsstrategy.com/charts/s8-04-headcount-by-department/