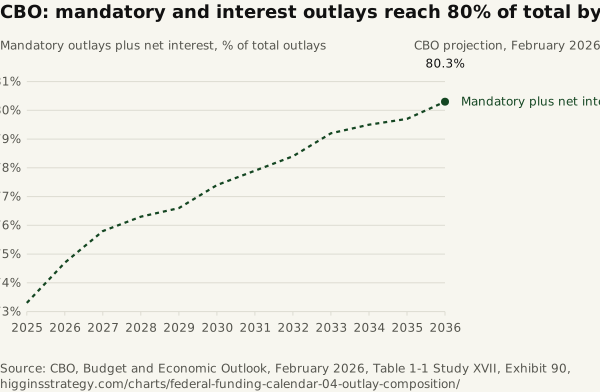
CBO: mandatory and interest outlays reach 80% of total by 2036
Source. CBO, Budget and Economic Outlook, February 2026, Table 1-1
Method and data
Method. The line is mandatory outlays plus net interest divided by total outlays, from the CBO Table 1-1 columns in the CSV and computed in mandatory_plus_net_interest_pct_of_outlays_derived (for 2036, 7,028 + 2,144 over 11,416 is 80.3%); 2025 is actual and the other years are baseline.
| Fiscal year | Mandatory outlays ($ billions) | Discretionary outlays ($ billions) | Net interest ($ billions) | Total outlays ($ billions) | Mandatory plus net interest (% of outlays, derived) | Status |
|---|---|---|---|---|---|---|
| 2025 | 4,168 | 1,872 | 970 | 7,010 | 73.3 | actual |
| 2026 | 4,529 | 1,880 | 1,039 | 7,449 | 74.7 | baseline |
| 2027 | 4,783 | 1,882 | 1,108 | 7,772 | 75.8 | baseline |
| 2028 | 5,005 | 1,929 | 1,218 | 8,151 | 76.3 | baseline |
| 2029 | 5,067 | 1,948 | 1,324 | 8,340 | 76.6 | baseline |
| 2030 | 5,375 | 1,989 | 1,432 | 8,796 | 77.4 | baseline |
| 2031 | 5,582 | 2,024 | 1,548 | 9,155 | 77.9 | baseline |
| 2032 | 5,835 | 2,063 | 1,670 | 9,569 | 78.4 | baseline |
| 2033 | 6,277 | 2,111 | 1,784 | 10,172 | 79.2 | baseline |
| 2034 | 6,437 | 2,147 | 1,904 | 10,487 | 79.5 | baseline |
| 2035 | 6,545 | 2,187 | 2,019 | 10,751 | 79.7 | baseline |
| 2036 | 7,028 | 2,244 | 2,144 | 11,416 | 80.3 | baseline |