The government has run a deficit in 52 of the 56 fiscal years since 1970
Source. OMB Historical Tables, FY2027 edition (April 2026), Table 1.1 and Table 10.1. Fiscal years 1901–2025; as a share of GDP from 1940.
Method and data
Method. Total receipts and outlays, on- and off-budget combined (OMB Table 1.1), over Table 10.1 GDP. 1901–1939 have no GDP series and are given in current dollars only; OMB prints 1913 and 1914 as a deficit of under $0.5 million, left blank here.
| Fiscal year | Surplus or deficit (% of GDP) | Receipts (% of GDP) | Outlays (% of GDP) | Surplus or deficit ($m) |
|---|---|---|---|---|
| 1901 | 63 | |||
| 1902 | 77 | |||
| 1903 | 45 | |||
| 1904 | −43 | |||
| 1905 | −23 | |||
| 1906 | 25 | |||
| 1907 | 87 | |||
| 1908 | −57 | |||
| 1909 | −89 | |||
| 1910 | −18 | |||
| 1911 | 11 | |||
| 1912 | 3 | |||
| 1913 | ||||
| 1914 | ||||
| 1915 | −63 | |||
| 1916 | 48 | |||
| 1917 | −853 | |||
| 1918 | −9,032 | |||
| 1919 | −13,363 | |||
| 1920 | 291 | |||
| 1921 | 509 | |||
| 1922 | 736 | |||
| 1923 | 713 | |||
| 1924 | 963 | |||
| 1925 | 717 | |||
| 1926 | 865 | |||
| 1927 | 1,155 | |||
| 1928 | 939 | |||
| 1929 | 734 | |||
| 1930 | 738 | |||
| 1931 | −462 | |||
| 1932 | −2,735 | |||
| 1933 | −2,602 | |||
| 1934 | −3,586 | |||
| 1935 | −2,803 | |||
| 1936 | −4,304 | |||
| 1937 | −2,193 | |||
| 1938 | −89 | |||
| 1939 | −2,846 | |||
| 1940 | −2.97 | 6.67 | 9.64 | −2,920 |
| 1941 | −4.25 | 7.5 | 11.75 | −4,941 |
| 1942 | −13.88 | 9.91 | 23.79 | −20,503 |
| 1943 | −29.55 | 13 | 42.55 | −54,554 |
| 1944 | −22.24 | 20.46 | 42.71 | −47,557 |
| 1945 | −21 | 19.95 | 40.95 | −47,553 |
| 1946 | −6.99 | 17.24 | 24.22 | −15,936 |
| 1947 | 1.68 | 16.12 | 14.44 | 4,018 |
| 1948 | 4.5 | 15.87 | 11.36 | 11,796 |
| 1949 | 0.21 | 14.25 | 14.05 | 580 |
| 1950 | −1.12 | 14.15 | 15.27 | −3,119 |
| 1951 | 1.87 | 15.78 | 13.92 | 6,102 |
| 1952 | −0.43 | 18.53 | 18.95 | −1,519 |
| 1953 | −1.7 | 18.22 | 19.92 | −6,493 |
| 1954 | −0.3 | 18 | 18.3 | −1,154 |
| 1955 | −0.74 | 16.11 | 16.84 | −2,993 |
| 1956 | 0.9 | 17.02 | 16.12 | 3,947 |
| 1957 | 0.74 | 17.26 | 16.53 | 3,412 |
| 1958 | −0.58 | 16.82 | 17.4 | −2,769 |
| 1959 | −2.55 | 15.71 | 18.25 | −12,849 |
| 1960 | 0.06 | 17.31 | 17.25 | 301 |
| 1961 | −0.61 | 17.27 | 17.88 | −3,335 |
| 1962 | −1.22 | 17.02 | 18.24 | −7,146 |
| 1963 | −0.77 | 17.24 | 18.01 | −4,756 |
| 1964 | −0.89 | 17.02 | 17.91 | −5,915 |
| 1965 | −0.2 | 16.47 | 16.67 | −1,411 |
| 1966 | −0.47 | 16.76 | 17.24 | −3,698 |
| 1967 | −1.03 | 17.79 | 18.82 | −8,643 |
| 1968 | −2.8 | 17.04 | 19.85 | −25,161 |
| 1969 | 0.33 | 19.06 | 18.73 | 3,242 |
| 1970 | −0.27 | 18.42 | 18.69 | −2,842 |
| 1971 | −2.06 | 16.76 | 18.82 | −23,033 |
| 1972 | −1.92 | 17.04 | 18.97 | −23,373 |
| 1973 | −1.1 | 17.06 | 18.16 | −14,908 |
| 1974 | −0.41 | 17.75 | 18.16 | −6,135 |
| 1975 | −3.31 | 17.37 | 20.68 | −53,242 |
| 1976 | −4.13 | 16.69 | 20.82 | −73,732 |
| 1977 | −2.65 | 17.56 | 20.22 | −53,659 |
| 1978 | −2.6 | 17.58 | 20.18 | −59,185 |
| 1979 | −1.59 | 18.06 | 19.65 | −40,726 |
| 1980 | −2.64 | 18.52 | 21.17 | −73,830 |
| 1981 | −2.52 | 19.13 | 21.65 | −78,968 |
| 1982 | −3.86 | 18.64 | 22.51 | −127,977 |
| 1983 | −5.88 | 16.98 | 22.86 | −207,802 |
| 1984 | −4.69 | 16.88 | 21.57 | −185,367 |
| 1985 | −4.98 | 17.21 | 22.19 | −212,308 |
| 1986 | −4.89 | 16.99 | 21.88 | −221,227 |
| 1987 | −3.14 | 17.92 | 21.06 | −149,730 |
| 1988 | −3.02 | 17.69 | 20.71 | −155,178 |
| 1989 | −2.75 | 17.84 | 20.59 | −152,639 |
| 1990 | −3.75 | 17.49 | 21.24 | −221,036 |
| 1991 | −4.42 | 17.31 | 21.73 | −269,238 |
| 1992 | −4.52 | 17.01 | 21.53 | −290,321 |
| 1993 | −3.76 | 17.04 | 20.8 | −255,051 |
| 1994 | −2.83 | 17.54 | 20.37 | −203,186 |
| 1995 | −2.17 | 17.88 | 20.05 | −163,952 |
| 1996 | −1.35 | 18.27 | 19.63 | −107,431 |
| 1997 | −0.26 | 18.69 | 18.95 | −21,884 |
| 1998 | 0.78 | 19.28 | 18.5 | 69,270 |
| 1999 | 1.33 | 19.28 | 17.95 | 125,610 |
| 2000 | 2.34 | 20.02 | 17.68 | 236,241 |
| 2001 | 1.22 | 18.92 | 17.7 | 128,236 |
| 2002 | −1.46 | 17.11 | 18.57 | −157,758 |
| 2003 | −3.35 | 15.8 | 19.15 | −377,585 |
| 2004 | −3.43 | 15.63 | 19.06 | −412,727 |
| 2005 | −2.48 | 16.77 | 19.25 | −318,346 |
| 2006 | −1.82 | 17.65 | 19.47 | −248,181 |
| 2007 | −1.12 | 17.95 | 19.07 | −160,701 |
| 2008 | −3.1 | 17.06 | 20.16 | −458,553 |
| 2009 | −9.76 | 14.55 | 24.31 | −1,412,688 |
| 2010 | −8.7 | 14.53 | 23.23 | −1,294,373 |
| 2011 | −8.4 | 14.89 | 23.3 | −1,299,599 |
| 2012 | −6.68 | 15.21 | 21.89 | −1,076,573 |
| 2013 | −4.07 | 16.63 | 20.7 | −679,775 |
| 2014 | −2.78 | 17.34 | 20.12 | −484,793 |
| 2015 | −2.43 | 17.89 | 20.32 | −441,960 |
| 2016 | −3.14 | 17.53 | 20.67 | −584,650 |
| 2017 | −3.43 | 17.12 | 20.55 | −665,450 |
| 2018 | −3.81 | 16.29 | 20.11 | −779,074 |
| 2019 | −4.62 | 16.27 | 20.89 | −983,588 |
| 2020 | −14.51 | 16.03 | 30.54 | −3,095,653 |
| 2021 | −12.04 | 17.56 | 29.6 | −2,773,594 |
| 2022 | −5.38 | 19.16 | 24.53 | −1,374,171 |
| 2023 | −6.16 | 16.21 | 22.37 | −1,687,467 |
| 2024 | −6.27 | 17 | 23.27 | −1,815,377 |
| 2025 | −5.85 | 17.27 | 23.12 | −1,774,684 |
Download SVG · CSV. Data and chart licensed CC BY 4.0.
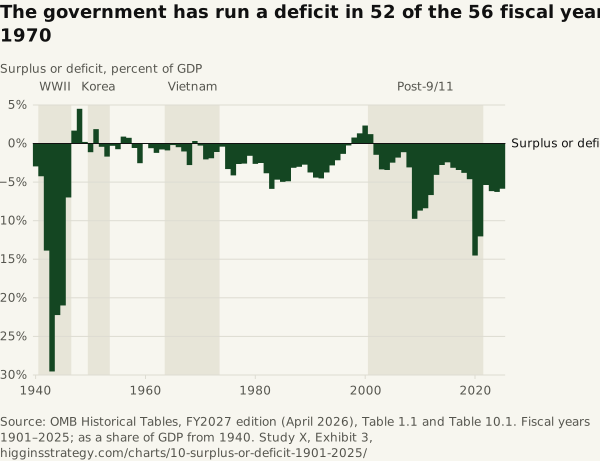
Higgins Strategy. “The government has run a deficit in 52 of the 56 fiscal years since 1970” Exhibit 3, The Debt, the Waste and the Tax (Study X). October 12, 2026. https://higginsstrategy.com/charts/10-surplus-or-deficit-1901-2025/