Net interest was 13.8% of federal outlays and 3.2% of GDP in FY2025
Source. OMB Historical Tables, FY2027 edition (April 2026), Table 3.1, share of outlays; CBO, The Long-Term Budget Outlook Data: 2026 to 2056 (February 25, 2026), Table 2, share of GDP 1940–2056, saved by hand from cbo.gov.
Method and data
Method. Net interest is function 900: interest paid less interest received by trust funds and others. The share of outlays is OMB’s (Table 3.1), charted for 1940–2025; OMB’s estimates for 2026–2031 are in the table and CSV. The share of GDP is CBO’s own series from one file, its historical values (which CBO draws from CBO and OMB data) for 1940–2025 and its extended-baseline projection for 2026–2056, so no seam joins two sources. OMB’s shares of GDP (net interest over Table 10.1 GDP) are in the CSV. Per resident divides by BEA’s annual population. National defense (function 050) and the other large functions are in the CSV, $m current.
| Fiscal year | Basis | Net interest (% of outlays, OMB) | Net interest (% of GDP, CBO) | Net interest ($m) | Per resident ($) |
|---|---|---|---|---|---|
| 1940 | Actual | 9.5 | 0.915 | 899 | 7 |
| 1941 | Actual | 6.9 | 0.812 | 943 | 7 |
| 1942 | Actual | 3 | 0.712 | 1,052 | 8 |
| 1943 | Actual | 1.9 | 0.828 | 1,529 | 11 |
| 1944 | Actual | 2.4 | 1.038 | 2,219 | 16 |
| 1945 | Actual | 3.4 | 1.375 | 3,112 | 22 |
| 1946 | Actual | 7.4 | 1.803 | 4,111 | 29 |
| 1947 | Actual | 12.2 | 1.76 | 4,204 | 29 |
| 1948 | Actual | 14.6 | 1.658 | 4,341 | 30 |
| 1949 | Actual | 11.6 | 1.636 | 4,523 | 30 |
| 1950 | Actual | 11.3 | 1.727 | 4,812 | 32 |
| 1951 | Actual | 10.2 | 1.426 | 4,665 | 30 |
| 1952 | Actual | 6.9 | 1.316 | 4,701 | 30 |
| 1953 | Actual | 6.8 | 1.35 | 5,156 | 32 |
| 1954 | Actual | 6.8 | 1.243 | 4,811 | 30 |
| 1955 | Actual | 7.1 | 1.194 | 4,850 | 29 |
| 1956 | Actual | 7.2 | 1.159 | 5,079 | 30 |
| 1957 | Actual | 7 | 1.155 | 5,354 | 31 |
| 1958 | Actual | 6.8 | 1.184 | 5,604 | 32 |
| 1959 | Actual | 6.3 | 1.142 | 5,762 | 33 |
| 1960 | Actual | 7.5 | 1.3 | 6,947 | 38 |
| 1961 | Actual | 6.9 | 1.229 | 6,716 | 37 |
| 1962 | Actual | 6.4 | 1.176 | 6,889 | 37 |
| 1963 | Actual | 7 | 1.252 | 7,740 | 41 |
| 1964 | Actual | 6.9 | 1.239 | 8,199 | 43 |
| 1965 | Actual | 7.3 | 1.211 | 8,591 | 44 |
| 1966 | Actual | 7 | 1.203 | 9,386 | 48 |
| 1967 | Actual | 6.5 | 1.227 | 10,268 | 52 |
| 1968 | Actual | 6.2 | 1.236 | 11,090 | 55 |
| 1969 | Actual | 6.9 | 1.295 | 12,699 | 63 |
| 1970 | Actual | 7.3 | 1.374 | 14,380 | 70 |
| 1971 | Actual | 7.1 | 1.329 | 14,841 | 71 |
| 1972 | Actual | 6.7 | 1.273 | 15,478 | 74 |
| 1973 | Actual | 7.1 | 1.283 | 17,349 | 82 |
| 1974 | Actual | 8 | 1.446 | 21,449 | 100 |
| 1975 | Actual | 7 | 1.446 | 23,244 | 108 |
| 1976 | Actual | 7.2 | 1.496 | 26,727 | 123 |
| 1977 | Actual | 7.3 | 1.477 | 29,901 | 136 |
| 1978 | Actual | 7.7 | 1.56 | 35,458 | 159 |
| 1979 | Actual | 8.5 | 1.662 | 42,633 | 189 |
| 1980 | Actual | 8.9 | 1.882 | 52,533 | 231 |
| 1981 | Actual | 10.1 | 2.195 | 68,766 | 299 |
| 1982 | Actual | 11.4 | 2.566 | 85,032 | 366 |
| 1983 | Actual | 11.1 | 2.54 | 89,808 | 383 |
| 1984 | Actual | 13 | 2.813 | 111,102 | 470 |
| 1985 | Actual | 13.7 | 3.036 | 129,478 | 543 |
| 1986 | Actual | 13.7 | 3.005 | 136,017 | 565 |
| 1987 | Actual | 13.8 | 2.907 | 138,611 | 571 |
| 1988 | Actual | 14.3 | 2.954 | 151,803 | 619 |
| 1989 | Actual | 14.8 | 3.042 | 168,981 | 683 |
| 1990 | Actual | 14.7 | 3.125 | 184,347 | 737 |
| 1991 | Actual | 14.7 | 3.191 | 194,448 | 767 |
| 1992 | Actual | 14.4 | 3.107 | 199,344 | 776 |
| 1993 | Actual | 14.1 | 2.933 | 198,713 | 763 |
| 1994 | Actual | 13.9 | 2.828 | 202,932 | 770 |
| 1995 | Actual | 15.3 | 3.07 | 232,134 | 871 |
| 1996 | Actual | 15.4 | 3.032 | 241,053 | 894 |
| 1997 | Actual | 15.2 | 2.887 | 243,984 | 894 |
| 1998 | Actual | 14.6 | 2.7 | 241,118 | 873 |
| 1999 | Actual | 13.5 | 2.424 | 229,755 | 823 |
| 2000 | Actual | 12.5 | 2.204 | 222,949 | 789 |
| 2001 | Actual | 11.1 | 1.959 | 206,167 | 723 |
| 2002 | Actual | 8.5 | 1.579 | 170,949 | 594 |
| 2003 | Actual | 7.1 | 1.357 | 153,073 | 527 |
| 2004 | Actual | 7 | 1.332 | 160,245 | 546 |
| 2005 | Actual | 7.4 | 1.433 | 183,986 | 622 |
| 2006 | Actual | 8.5 | 1.662 | 226,603 | 758 |
| 2007 | Actual | 8.7 | 1.657 | 237,109 | 786 |
| 2008 | Actual | 8.5 | 1.708 | 252,757 | 830 |
| 2009 | Actual | 5.3 | 1.292 | 186,902 | 608 |
| 2010 | Actual | 5.7 | 1.318 | 196,194 | 633 |
| 2011 | Actual | 6.4 | 1.487 | 229,962 | 736 |
| 2012 | Actual | 6.2 | 1.368 | 220,408 | 700 |
| 2013 | Actual | 6.4 | 1.324 | 220,885 | 697 |
| 2014 | Actual | 6.5 | 1.314 | 228,956 | 716 |
| 2015 | Actual | 6 | 1.229 | 223,181 | 693 |
| 2016 | Actual | 6.2 | 1.288 | 240,033 | 739 |
| 2017 | Actual | 6.6 | 1.355 | 262,551 | 803 |
| 2018 | Actual | 7.9 | 1.59 | 324,975 | 988 |
| 2019 | Actual | 8.4 | 1.762 | 375,158 | 1,135 |
| 2020 | Actual | 5.3 | 1.619 | 345,470 | 1,041 |
| 2021 | Actual | 5.2 | 1.529 | 352,338 | 1,060 |
| 2022 | Actual | 7.6 | 1.861 | 475,887 | 1,423 |
| 2023 | Actual | 10.7 | 2.403 | 658,267 | 1,953 |
| 2024 | Actual | 13.1 | 3.04 | 879,879 | 2,587 |
| 2025 | Actual | 13.8 | 3.195 | 970,065 | 2,837 |
| 2026 | OMB estimate; CBO projection | 13.5 | 3.257 | 1,016,650 | 2,966 |
| 2027 | OMB estimate; CBO projection | 13.2 | 3.325 | 1,065,368 | |
| 2028 | OMB estimate; CBO projection | 13.8 | 3.513 | 1,166,961 | |
| 2029 | OMB estimate; CBO projection | 14.3 | 3.678 | 1,234,644 | |
| 2030 | OMB estimate; CBO projection | 14.5 | 3.829 | 1,304,508 | |
| 2031 | OMB estimate; CBO projection | 14.7 | 3.989 | 1,363,769 | |
| 2032 | CBO projection | 4.147 | |||
| 2033 | CBO projection | 4.269 | |||
| 2034 | CBO projection | 4.389 | |||
| 2035 | CBO projection | 4.486 | |||
| 2036 | CBO projection | 4.591 | |||
| 2037 | CBO projection | 4.687 | |||
| 2038 | CBO projection | 4.788 | |||
| 2039 | CBO projection | 4.887 | |||
| 2040 | CBO projection | 4.989 | |||
| 2041 | CBO projection | 5.097 | |||
| 2042 | CBO projection | 5.217 | |||
| 2043 | CBO projection | 5.334 | |||
| 2044 | CBO projection | 5.443 | |||
| 2045 | CBO projection | 5.554 | |||
| 2046 | CBO projection | 5.676 | |||
| 2047 | CBO projection | 5.792 | |||
| 2048 | CBO projection | 5.907 | |||
| 2049 | CBO projection | 6.022 | |||
| 2050 | CBO projection | 6.143 | |||
| 2051 | CBO projection | 6.269 | |||
| 2052 | CBO projection | 6.4 | |||
| 2053 | CBO projection | 6.529 | |||
| 2054 | CBO projection | 6.658 | |||
| 2055 | CBO projection | 6.79 | |||
| 2056 | CBO projection | 6.93 |
Download SVG · CSV. Data and chart licensed CC BY 4.0.
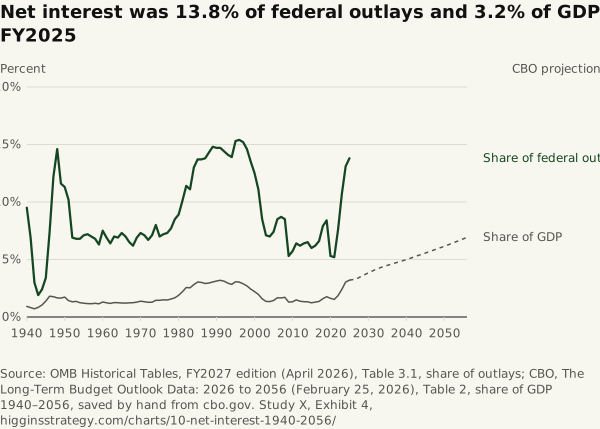
Higgins Strategy. “Net interest was 13.8% of federal outlays and 3.2% of GDP in FY2025” Exhibit 4, The Debt, the Waste and the Tax (Study X). October 12, 2026. https://higginsstrategy.com/charts/10-net-interest-1940-2056/