Agencies reported $185.8 billion of improper payments in FY2025, up from $161.5 billion
Source. PaymentAccuracy.gov (OMB), FY2025 dataset, “All Program Results”. Fiscal years 2004–2025.
Method and data
Method. Improper and unknown payments by program and fiscal year, summed by year; the rate is improper payments over the outlays of the programs that report. The totals match GAO’s published government-wide figures to within rounding. FY2003 is GAO’s $35 billion (not charted); with it the total since 2003 is about $3.02 trillion ($2,984 billion + $35 billion), GAO’s “about $3 trillion”. Not every improper payment is a loss: GAO’s “monetary loss” figures are lower, and underpayments are included.
| Fiscal year | Improper payments ($bn) | Outlays of reporting programs ($bn) | Programs reporting | Rate (%) |
|---|---|---|---|---|
| 2004 | 45.0 | 1,035 | 27 | 4.35 |
| 2005 | 38.4 | 1,225 | 43 | 3.14 |
| 2006 | 40.6 | 1,394 | 53 | 2.91 |
| 2007 | 42.0 | 1,493 | 64 | 2.81 |
| 2008 | 72.8 | 1,844 | 74 | 3.95 |
| 2009 | 105.1 | 1,941 | 65 | 5.42 |
| 2010 | 120.8 | 2,285 | 70 | 5.29 |
| 2011 | 115.3 | 2,460 | 78 | 4.69 |
| 2012 | 107.7 | 2,475 | 75 | 4.35 |
| 2013 | 105.9 | 2,998 | 84 | 3.53 |
| 2014 | 124.6 | 3,102 | 122 | 4.02 |
| 2015 | 137.0 | 3,121 | 121 | 4.39 |
| 2016 | 144.4 | 3,090 | 112 | 4.67 |
| 2017 | 140.9 | 3,122 | 88 | 4.51 |
| 2018 | 150.7 | 3,287 | 78 | 4.58 |
| 2019 | 174.8 | 3,455 | 79 | 5.06 |
| 2020 | 206.4 | 3,689 | 100 | 5.60 |
| 2021 | 281.4 | 3,928 | 87 | 7.16 |
| 2022 | 247.0 | 4,822 | 82 | 5.12 |
| 2023 | 235.8 | 4,349 | 71 | 5.42 |
| 2024 | 161.5 | 4,072 | 68 | 3.97 |
| 2025 | 185.8 | 4,474 | 64 | 4.15 |
Download SVG · CSV. Data and chart licensed CC BY 4.0.
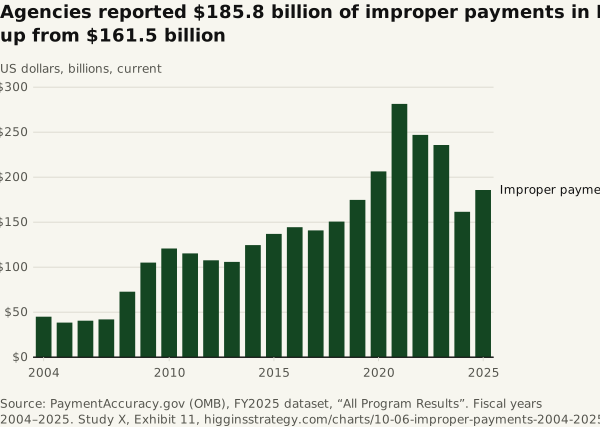
Higgins Strategy. “Agencies reported $185.8 billion of improper payments in FY2025, up from $161.5 billion” Exhibit 11, The Debt, the Waste and the Tax (Study X). October 12, 2026. https://higginsstrategy.com/charts/10-06-improper-payments-2004-2025/