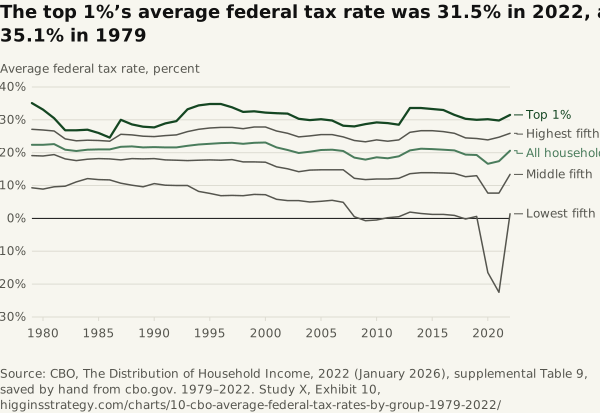
The top 1%’s average federal tax rate was 31.5% in 2022, against 35.1% in 1979
Source. CBO, The Distribution of Household Income, 2022 (January 2026), supplemental Table 9, saved by hand from cbo.gov. 1979–2022.
Method and data
Method. All federal taxes, including payroll, corporate and excise, allocated to households, as a share of income before transfers and taxes, for four income groups and all households. CBO allocates employer payroll taxes to workers and corporate taxes to owners of capital and workers, and ranks households by income before transfers and taxes, adjusted for size. Every group CBO publishes, with the rate by tax, is in 10-07-cbo-average-federal-tax-rates-1979-2022.csv.
| Year | Top 1% | Highest fifth | Middle fifth | Lowest fifth | All households |
|---|---|---|---|---|---|
| 1979 | 35.1 | 27.1 | 19.1 | 9.3 | 22.4 |
| 1980 | 33.1 | 26.9 | 19.0 | 8.9 | 22.4 |
| 1981 | 30.5 | 26.6 | 19.4 | 9.6 | 22.6 |
| 1982 | 26.8 | 24.2 | 18.1 | 9.8 | 20.9 |
| 1983 | 26.8 | 23.6 | 17.6 | 11.1 | 20.5 |
| 1984 | 27.0 | 23.8 | 18.0 | 12.1 | 20.9 |
| 1985 | 26.0 | 23.7 | 18.2 | 11.8 | 21.0 |
| 1986 | 24.6 | 23.5 | 18.1 | 11.7 | 21.0 |
| 1987 | 30.0 | 25.6 | 17.8 | 10.7 | 21.8 |
| 1988 | 28.6 | 25.4 | 18.2 | 10.1 | 21.9 |
| 1989 | 27.9 | 25.0 | 18.1 | 9.6 | 21.6 |
| 1990 | 27.7 | 24.9 | 18.2 | 10.6 | 21.7 |
| 1991 | 28.9 | 25.2 | 17.8 | 10.1 | 21.6 |
| 1992 | 29.6 | 25.4 | 17.7 | 10.0 | 21.6 |
| 1993 | 33.2 | 26.4 | 17.6 | 10.0 | 22.1 |
| 1994 | 34.4 | 27.1 | 17.7 | 8.2 | 22.5 |
| 1995 | 34.8 | 27.5 | 17.8 | 7.6 | 22.7 |
| 1996 | 34.8 | 27.7 | 17.7 | 6.9 | 22.9 |
| 1997 | 33.8 | 27.7 | 17.9 | 7.0 | 23.0 |
| 1998 | 32.4 | 27.3 | 17.2 | 6.9 | 22.7 |
| 1999 | 32.6 | 27.8 | 17.2 | 7.3 | 23.0 |
| 2000 | 32.2 | 27.8 | 17.1 | 7.2 | 23.1 |
| 2001 | 32.0 | 26.6 | 15.7 | 5.8 | 21.6 |
| 2002 | 31.9 | 25.9 | 15.1 | 5.4 | 20.8 |
| 2003 | 30.3 | 24.8 | 14.2 | 5.4 | 19.9 |
| 2004 | 29.9 | 25.1 | 14.7 | 5.0 | 20.3 |
| 2005 | 30.2 | 25.5 | 14.8 | 5.2 | 20.8 |
| 2006 | 29.8 | 25.5 | 14.8 | 5.5 | 20.9 |
| 2007 | 28.2 | 24.8 | 14.8 | 4.9 | 20.5 |
| 2008 | 28.0 | 23.7 | 12.2 | 0.5 | 18.5 |
| 2009 | 28.7 | 23.3 | 11.8 | −0.7 | 17.9 |
| 2010 | 29.2 | 23.9 | 12.0 | −0.5 | 18.6 |
| 2011 | 29.0 | 23.5 | 12.0 | 0.2 | 18.3 |
| 2012 | 28.5 | 23.9 | 12.2 | 0.5 | 18.9 |
| 2013 | 33.6 | 26.2 | 13.6 | 1.9 | 20.7 |
| 2014 | 33.6 | 26.7 | 13.9 | 1.5 | 21.2 |
| 2015 | 33.3 | 26.7 | 13.9 | 1.2 | 21.1 |
| 2016 | 33.0 | 26.4 | 13.8 | 1.2 | 20.9 |
| 2017 | 31.5 | 25.9 | 13.7 | 0.9 | 20.7 |
| 2018 | 30.3 | 24.5 | 12.7 | −0.2 | 19.4 |
| 2019 | 30.0 | 24.3 | 13.0 | 0.6 | 19.3 |
| 2020 | 30.2 | 23.9 | 7.7 | −16.5 | 16.6 |
| 2021 | 29.8 | 24.7 | 7.7 | −22.5 | 17.4 |
| 2022 | 31.5 | 25.9 | 13.4 | 1.4 | 20.6 |
Download 10-cbo-average-federal-tax-rates-by-group-1979-2022.csv
Download SVG · CSV. Data and chart licensed CC BY 4.0.
Higgins Strategy. “The top 1%’s average federal tax rate was 31.5% in 2022, against 35.1% in 1979” Exhibit 10, The Debt, the Waste and the Tax (Study X). October 12, 2026. https://higginsstrategy.com/charts/10-cbo-average-federal-tax-rates-by-group-1979-2022/