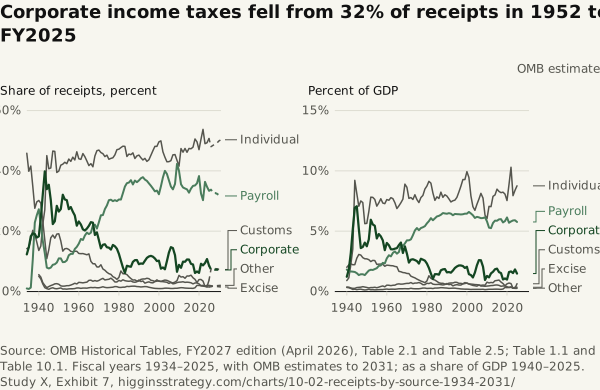
Corporate income taxes fell from 32% of receipts in 1952 to 8.6% in FY2025
Source. OMB Historical Tables, FY2027 edition (April 2026), Table 2.1 and Table 2.5; Table 1.1 and Table 10.1. Fiscal years 1934–2025, with OMB estimates to 2031; as a share of GDP 1940–2025.
Method and data
Method. Receipts by source from OMB Table 2.1 (individual income taxes, corporation income taxes, social insurance and retirement receipts, excise taxes, other) and Table 2.5 (customs duties, estate and gift taxes and miscellaneous receipts, which make up “other”; Table 2.5 begins in 1940, so 1934–1939 carry “other” whole). Each source is shown as a share of total receipts, 1934–2031 with OMB’s estimates from 2026, and as a share of GDP, 1940–2025: its share of receipts times total receipts as a percent of GDP (Tables 1.1 and 10.1). Dollar amounts ($m) are in the CSV.
| Fiscal year | Basis | Individual (%) | Payroll (%) | Corporate (%) | Excise (%) | Customs (%) | Estate and gift (%) | Misc. (%) | Other, 1934–39 (%) | Receipts (% of GDP) |
|---|---|---|---|---|---|---|---|---|---|---|
| 1934 | OMB | 14.21 | 1.02 | 12.32 | 45.82 | 26.67 | ||||
| 1935 | OMB | 14.6 | 0.86 | 14.66 | 39.87 | 30.04 | ||||
| 1936 | OMB | 17.18 | 1.33 | 18.33 | 41.58 | 21.59 | ||||
| 1937 | OMB | 20.27 | 10.77 | 19.27 | 34.82 | 14.87 | ||||
| 1938 | OMB | 19.05 | 22.83 | 19.06 | 27.6 | 11.45 | ||||
| 1939 | OMB | 16.35 | 25.31 | 17.9 | 29.72 | 10.72 | ||||
| 1940 | OMB | 13.62 | 27.26 | 18.28 | 30.19 | 5.05 | 5.39 | 0.21 | 6.67 | |
| 1941 | OMB | 15.08 | 22.27 | 24.38 | 29.29 | 4.19 | 4.63 | 0.16 | 7.5 | |
| 1942 | OMB | 22.3 | 16.76 | 32.25 | 23.23 | 2.52 | 2.87 | 0.08 | 9.91 | |
| 1943 | OMB | 27.1 | 12.68 | 39.82 | 17.07 | 1.28 | 1.84 | 0.21 | 13 | |
| 1944 | OMB | 45.04 | 7.94 | 33.92 | 10.88 | 0.95 | 1.16 | 0.11 | 20.46 | |
| 1945 | OMB | 40.68 | 7.64 | 35.4 | 13.87 | 0.76 | 1.41 | 0.23 | 19.95 | |
| 1946 | OMB | 40.97 | 7.93 | 30.24 | 17.81 | 1.08 | 1.7 | 0.28 | 17.24 | |
| 1947 | OMB | 46.57 | 8.89 | 22.37 | 18.72 | 1.24 | 2 | 0.22 | 16.12 | |
| 1948 | OMB | 46.47 | 9.03 | 23.29 | 17.7 | 0.97 | 2.14 | 0.4 | 15.87 | |
| 1949 | OMB | 39.46 | 9.59 | 28.4 | 19.03 | 0.93 | 1.98 | 0.61 | 14.25 | |
| 1950 | OMB | 39.94 | 11 | 26.49 | 19.14 | 1.03 | 1.77 | 0.63 | 14.15 | |
| 1951 | OMB | 41.88 | 10.99 | 27.32 | 16.75 | 1.18 | 1.37 | 0.51 | 15.78 | |
| 1952 | OMB | 42.22 | 9.74 | 32.08 | 13.38 | 0.81 | 1.24 | 0.54 | 18.53 | |
| 1953 | OMB | 42.83 | 9.8 | 30.51 | 14.19 | 0.86 | 1.27 | 0.54 | 18.22 | |
| 1954 | OMB | 42.38 | 10.34 | 30.27 | 14.27 | 0.78 | 1.34 | 0.62 | 18 | |
| 1955 | OMB | 43.92 | 12.01 | 27.29 | 13.95 | 0.89 | 1.41 | 0.52 | 16.11 | |
| 1956 | OMB | 43.15 | 12.5 | 27.99 | 13.31 | 0.91 | 1.56 | 0.57 | 17.02 | |
| 1957 | OMB | 44.53 | 12.5 | 26.46 | 13.17 | 0.92 | 1.71 | 0.72 | 17.26 | |
| 1958 | OMB | 43.6 | 14.11 | 25.21 | 13.36 | 0.98 | 1.75 | 0.99 | 16.82 | |
| 1959 | OMB | 46.33 | 14.79 | 21.84 | 13.35 | 1.17 | 1.68 | 0.84 | 15.71 | |
| 1960 | OMB | 44.02 | 15.87 | 23.24 | 12.62 | 1.19 | 1.74 | 1.31 | 17.31 | |
| 1961 | OMB | 43.8 | 17.42 | 22.2 | 12.57 | 1.04 | 2.01 | 0.97 | 17.27 | |
| 1962 | OMB | 45.72 | 17.1 | 20.59 | 12.57 | 1.15 | 2.02 | 0.85 | 17.02 | |
| 1963 | OMB | 44.66 | 18.58 | 20.25 | 12.38 | 1.13 | 2.03 | 0.96 | 17.24 | |
| 1964 | OMB | 43.24 | 19.5 | 20.86 | 12.19 | 1.11 | 2.13 | 0.96 | 17.02 | |
| 1965 | OMB | 41.77 | 19.04 | 21.8 | 12.47 | 1.23 | 2.33 | 1.36 | 16.47 | |
| 1966 | OMB | 42.38 | 19.53 | 22.99 | 9.98 | 1.35 | 2.34 | 1.43 | 16.76 | |
| 1967 | OMB | 41.34 | 21.92 | 22.83 | 9.22 | 1.28 | 2 | 1.42 | 17.79 | |
| 1968 | OMB | 44.93 | 22.18 | 18.74 | 9.2 | 1.33 | 1.99 | 1.63 | 17.04 | |
| 1969 | OMB | 46.69 | 20.88 | 19.63 | 8.15 | 1.24 | 1.87 | 1.56 | 19.06 | |
| 1970 | OMB | 46.89 | 23.01 | 17.03 | 8.15 | 1.26 | 1.89 | 1.78 | 18.42 | |
| 1971 | OMB | 46.08 | 25.29 | 14.31 | 8.88 | 1.38 | 2 | 2.06 | 16.76 | |
| 1972 | OMB | 45.7 | 25.36 | 15.52 | 7.47 | 1.59 | 2.62 | 1.75 | 17.04 | |
| 1973 | OMB | 44.73 | 27.35 | 15.66 | 7.05 | 1.38 | 2.13 | 1.7 | 17.06 | |
| 1974 | OMB | 45.19 | 28.52 | 14.67 | 6.4 | 1.27 | 1.91 | 2.04 | 17.75 | |
| 1975 | OMB | 43.85 | 30.29 | 14.55 | 5.93 | 1.32 | 1.65 | 2.4 | 17.37 | |
| 1976 | OMB | 44.15 | 30.45 | 13.89 | 5.69 | 1.37 | 1.75 | 2.69 | 16.69 | |
| 1977 | OMB | 44.33 | 29.95 | 15.44 | 4.94 | 1.45 | 2.06 | 1.84 | 17.56 | |
| 1978 | OMB | 45.3 | 30.27 | 15 | 4.6 | 1.65 | 1.32 | 1.86 | 17.58 | |
| 1979 | OMB | 47.02 | 29.99 | 14.18 | 4.05 | 1.61 | 1.17 | 2 | 18.06 | |
| 1980 | OMB | 47.2 | 30.52 | 12.49 | 4.7 | 1.39 | 1.24 | 2.47 | 18.52 | |
| 1981 | OMB | 47.71 | 30.49 | 10.2 | 6.81 | 1.35 | 1.13 | 2.3 | 19.13 | |
| 1982 | OMB | 48.2 | 32.62 | 7.97 | 5.88 | 1.43 | 1.29 | 2.62 | 18.64 | |
| 1983 | OMB | 48.11 | 34.8 | 6.16 | 5.88 | 1.44 | 1.01 | 2.6 | 16.98 | |
| 1984 | OMB | 44.78 | 35.92 | 8.54 | 5.61 | 1.71 | 0.9 | 2.55 | 16.88 | |
| 1985 | OMB | 45.57 | 36.12 | 8.36 | 4.9 | 1.65 | 0.87 | 2.52 | 17.21 | |
| 1986 | OMB | 45.37 | 36.91 | 8.21 | 4.28 | 1.73 | 0.9 | 2.59 | 16.99 | |
| 1987 | OMB | 45.95 | 35.51 | 9.82 | 3.8 | 1.77 | 0.88 | 2.28 | 17.92 | |
| 1988 | OMB | 44.12 | 36.77 | 10.39 | 3.87 | 1.78 | 0.84 | 2.22 | 17.69 | |
| 1989 | OMB | 44.97 | 36.26 | 10.42 | 3.47 | 1.65 | 0.88 | 2.35 | 17.84 | |
| 1990 | OMB | 45.24 | 36.83 | 9.06 | 3.43 | 1.62 | 1.11 | 2.71 | 17.49 | |
| 1991 | OMB | 44.34 | 37.54 | 9.3 | 4.02 | 1.51 | 1.06 | 2.23 | 17.31 | |
| 1992 | OMB | 43.62 | 37.91 | 9.19 | 4.18 | 1.59 | 1.02 | 2.49 | 17.01 | |
| 1993 | OMB | 44.15 | 37.1 | 10.18 | 4.16 | 1.63 | 1.09 | 1.68 | 17.04 | |
| 1994 | OMB | 43.15 | 36.67 | 11.15 | 4.39 | 1.6 | 1.21 | 1.84 | 17.54 | |
| 1995 | OMB | 43.66 | 35.84 | 11.61 | 4.25 | 1.43 | 1.09 | 2.11 | 17.88 | |
| 1996 | OMB | 45.18 | 35.06 | 11.83 | 3.72 | 1.28 | 1.18 | 1.76 | 18.27 | |
| 1997 | OMB | 46.7 | 34.15 | 11.54 | 3.6 | 1.14 | 1.26 | 1.61 | 18.69 | |
| 1998 | OMB | 48.13 | 33.21 | 10.96 | 3.35 | 1.06 | 1.4 | 1.89 | 19.28 | |
| 1999 | OMB | 48.13 | 33.48 | 10.11 | 3.85 | 1 | 1.52 | 1.91 | 19.28 | |
| 2000 | OMB | 49.6 | 32.24 | 10.24 | 3.4 | 0.98 | 1.43 | 2.11 | 20.02 | |
| 2001 | OMB | 49.94 | 34.85 | 7.59 | 3.33 | 0.97 | 1.43 | 1.89 | 18.92 | |
| 2002 | OMB | 46.32 | 37.81 | 7.99 | 3.61 | 1 | 1.43 | 1.83 | 17.11 | |
| 2003 | OMB | 44.53 | 40 | 7.39 | 3.79 | 1.11 | 1.23 | 1.94 | 15.8 | |
| 2004 | OMB | 43.03 | 39.01 | 10.07 | 3.72 | 1.12 | 1.32 | 1.73 | 15.63 | |
| 2005 | OMB | 43.05 | 36.87 | 12.92 | 3.39 | 1.09 | 1.15 | 1.52 | 16.77 | |
| 2006 | OMB | 43.37 | 34.81 | 14.7 | 3.07 | 1.03 | 1.16 | 1.85 | 17.65 | |
| 2007 | OMB | 45.31 | 33.86 | 14.42 | 2.53 | 1.01 | 1.01 | 1.85 | 17.95 | |
| 2008 | OMB | 45.39 | 35.66 | 12.06 | 2.67 | 1.09 | 1.14 | 1.98 | 17.06 | |
| 2009 | OMB | 43.48 | 42.32 | 6.57 | 2.97 | 1.07 | 1.12 | 2.48 | 14.55 | |
| 2010 | OMB | 41.55 | 39.99 | 8.85 | 3.09 | 1.17 | 0.87 | 4.48 | 14.53 | |
| 2011 | OMB | 47.38 | 35.55 | 7.86 | 3.14 | 1.28 | 0.32 | 4.46 | 14.89 | |
| 2012 | OMB | 46.21 | 34.5 | 9.89 | 3.23 | 1.24 | 0.57 | 4.36 | 15.21 | |
| 2013 | OMB | 47.44 | 34.15 | 9.86 | 3.03 | 1.15 | 0.68 | 3.7 | 16.63 | |
| 2014 | OMB | 46.15 | 33.87 | 10.61 | 3.09 | 1.12 | 0.64 | 4.51 | 17.34 | |
| 2015 | OMB | 47.41 | 32.78 | 10.58 | 3.02 | 1.08 | 0.59 | 4.54 | 17.89 | |
| 2016 | OMB | 47.31 | 34.12 | 9.17 | 2.91 | 1.07 | 0.65 | 4.77 | 17.53 | |
| 2017 | OMB | 47.86 | 35.04 | 8.96 | 2.53 | 1.04 | 0.69 | 3.89 | 17.12 | |
| 2018 | OMB | 50.56 | 35.16 | 6.15 | 2.85 | 1.24 | 0.69 | 3.35 | 16.29 | |
| 2019 | OMB | 49.6 | 35.89 | 6.65 | 2.86 | 2.04 | 0.48 | 2.48 | 16.27 | |
| 2020 | OMB | 47.02 | 38.29 | 6.19 | 2.54 | 2 | 0.52 | 3.44 | 16.03 | |
| 2021 | OMB | 50.51 | 32.47 | 9.19 | 1.86 | 1.98 | 0.67 | 3.32 | 17.56 | |
| 2022 | OMB | 53.75 | 30.29 | 8.68 | 1.79 | 2.04 | 0.66 | 2.79 | 19.16 | |
| 2023 | OMB | 49.01 | 36.35 | 9.45 | 1.71 | 1.81 | 0.76 | 0.91 | 16.21 | |
| 2024 | OMB | 49.31 | 34.74 | 10.77 | 2.06 | 1.57 | 0.64 | 0.91 | 17 | |
| 2025 | OMB | 50.72 | 33.39 | 8.63 | 2.02 | 3.72 | 0.56 | 0.95 | 17.27 | |
| 2026 | OMB estimate | 48.03 | 33.78 | 7.28 | 1.93 | 7.42 | 0.65 | 0.91 | ||
| 2027 | OMB estimate | 48.46 | 32.67 | 7.43 | 1.81 | 7.84 | 0.71 | 1.08 | ||
| 2028 | OMB estimate | 48.88 | 32.66 | 7.24 | 1.71 | 7.62 | 0.72 | 1.16 | ||
| 2029 | OMB estimate | 49.25 | 32.41 | 7.23 | 1.66 | 7.51 | 0.71 | 1.23 | ||
| 2030 | OMB estimate | 49.94 | 31.89 | 7.23 | 1.58 | 7.34 | 0.72 | 1.28 | ||
| 2031 | OMB estimate | 50.3 | 31.68 | 7.15 | 1.5 | 7.3 | 0.72 | 1.33 |
Download SVG · CSV. Data and chart licensed CC BY 4.0.
Higgins Strategy. “Corporate income taxes fell from 32% of receipts in 1952 to 8.6% in FY2025” Exhibit 7, The Debt, the Waste and the Tax (Study X). October 12, 2026. https://higginsstrategy.com/charts/10-02-receipts-by-source-1934-2031/