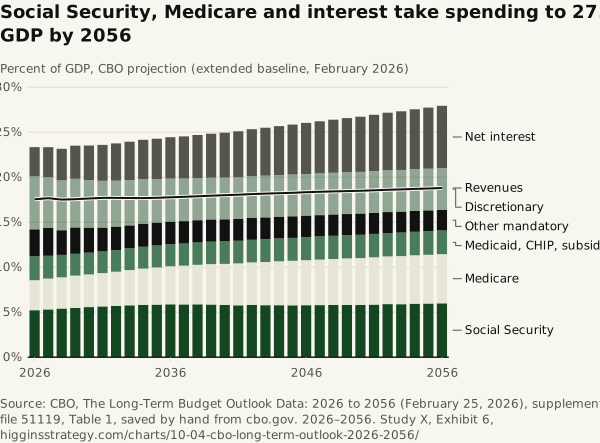
Social Security, Medicare and interest take spending to 27.9% of GDP by 2056
Source. CBO, The Long-Term Budget Outlook Data: 2026 to 2056 (February 25, 2026), supplemental file 51119, Table 1, saved by hand from cbo.gov. 2026–2056.
Method and data
Method. CBO’s extended baseline: current law as of the FY2026 baseline, no recessions, no policy change. Spending is stacked by category, Social Security, Medicare (net of premiums and other offsetting receipts), Medicaid with CHIP and marketplace subsidies, other mandatory, discretionary and net interest; the line is revenues. Noninterest spending plus net interest equals total spending in every year (checked when the site is built). The revenue components and the debt are in the CSV.
| Year | Social Security | Medicare | Medicaid, CHIP, subsidies | Other mandatory | Discretionary | Net interest | Total spending | Revenues |
|---|---|---|---|---|---|---|---|---|
| 2026 | 5.222 | 3.332 | 2.64997 | 2.994 | 5.894 | 3.257 | 23.348 | 17.541 |
| 2027 | 5.31 | 3.422 | 2.537 | 3.088 | 5.648 | 3.325 | 23.33 | 17.665 |
| 2028 | 5.409 | 3.47 | 2.485 | 2.732 | 5.548 | 3.513 | 23.157 | 17.514 |
| 2029 | 5.494 | 3.57 | 2.428 | 2.905 | 5.426 | 3.678 | 23.502 | 17.55 |
| 2030 | 5.57 | 3.627 | 2.411 | 2.767 | 5.319 | 3.829 | 23.524 | 17.638 |
| 2031 | 5.642 | 3.702 | 2.397 | 2.642 | 5.216 | 3.989 | 23.588 | 17.699 |
| 2032 | 5.706 | 3.789 | 2.406 | 2.587 | 5.123 | 4.147 | 23.759 | 17.702 |
| 2033 | 5.763 | 3.919 | 2.418 | 2.536 | 5.035 | 4.269 | 23.941 | 17.685 |
| 2034 | 5.809 | 4.037 | 2.426 | 2.541 | 4.9497 | 4.389 | 24.151 | 17.681 |
| 2035 | 5.847 | 4.128 | 2.436 | 2.509 | 4.874 | 4.486 | 24.28 | 17.711 |
| 2036 | 5.88 | 4.216 | 2.452 | 2.497 | 4.804 | 4.591 | 24.439 | 17.77 |
| 2037 | 5.869 | 4.298 | 2.459 | 2.484 | 4.738 | 4.687 | 24.535 | 17.826 |
| 2038 | 5.878 | 4.392 | 2.471 | 2.473 | 4.689 | 4.788 | 24.691 | 17.88 |
| 2039 | 5.861 | 4.484 | 2.484 | 2.456 | 4.657 | 4.887 | 24.829 | 17.945 |
| 2040 | 5.805 | 4.565 | 2.496 | 2.443 | 4.641 | 4.989 | 24.939 | 17.998 |
| 2041 | 5.77 | 4.652 | 2.508 | 2.433 | 4.641 | 5.097 | 25.102 | 18.06 |
| 2042 | 5.798 | 4.732 | 2.52 | 2.42 | 4.641 | 5.217 | 25.328 | 18.12 |
| 2043 | 5.778 | 4.805 | 2.532 | 2.41 | 4.641 | 5.334 | 25.5 | 18.183 |
| 2044 | 5.778 | 4.873 | 2.542 | 2.398 | 4.641 | 5.443 | 25.675 | 18.223 |
| 2045 | 5.772 | 4.937 | 2.55 | 2.388 | 4.641 | 5.554 | 25.842 | 18.268 |
| 2046 | 5.774 | 5.001 | 2.558 | 2.378 | 4.641 | 5.676 | 26.029 | 18.328 |
| 2047 | 5.789 | 5.056 | 2.568 | 2.367 | 4.641 | 5.792 | 26.213 | 18.374 |
| 2048 | 5.799 | 5.112 | 2.575 | 2.358 | 4.641 | 5.907 | 26.392 | 18.427 |
| 2049 | 5.808 | 5.165 | 2.584 | 2.347 | 4.641 | 6.022 | 26.568 | 18.455 |
| 2050 | 5.801 | 5.212 | 2.592 | 2.338 | 4.641 | 6.143 | 26.727 | 18.489 |
| 2051 | 5.84 | 5.261 | 2.597 | 2.329 | 4.641 | 6.269 | 26.938 | 18.544 |
| 2052 | 5.897 | 5.303 | 2.605 | 2.32 | 4.641 | 6.4 | 27.166 | 18.601 |
| 2053 | 5.889 | 5.341 | 2.611 | 2.312 | 4.641 | 6.529 | 27.323 | 18.647 |
| 2054 | 5.945 | 5.376 | 2.617 | 2.302 | 4.641 | 6.658 | 27.54 | 18.704 |
| 2055 | 5.968 | 5.415 | 2.625 | 2.294 | 4.641 | 6.79 | 27.733 | 18.741 |
| 2056 | 5.991 | 5.454 | 2.631 | 2.285 | 4.641 | 6.93 | 27.932 | 18.798 |
Download SVG · CSV. Data and chart licensed CC BY 4.0.
Higgins Strategy. “Social Security, Medicare and interest take spending to 27.9% of GDP by 2056” Exhibit 6, The Debt, the Waste and the Tax (Study X). October 12, 2026. https://higginsstrategy.com/charts/10-04-cbo-long-term-outlook-2026-2056/