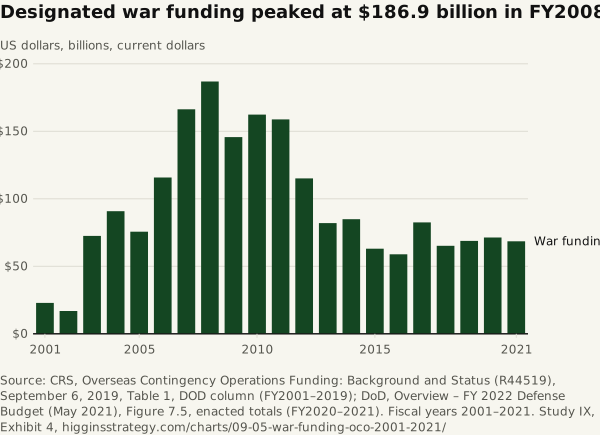
Designated war funding peaked at $186.9 billion in FY2008
Source. CRS, Overseas Contingency Operations Funding: Background and Status (R44519), September 6, 2019, Table 1, DOD column (FY2001–2019); DoD, Overview – FY 2022 Defense Budget (May 2021), Figure 7.5, enacted totals (FY2020–2021). Fiscal years 2001–2021.
Method and data
Method. CRS’s tabulation of DoD emergency and OCO appropriations FY2001–2019, extended with the FY2020 and FY2021 enacted OCO totals (after rescissions) from the DoD budget overview; it is budget authority, not outlays. Fiscal 2025 dollars and per resident use the Table 10.1 deflator and BEA population.
| Fiscal year | War funding ($bn, current) | War funding ($bn, FY2025) | Per resident that year (FY2025 $) |
|---|---|---|---|
| 2001 | 22.9 | 39.6 | 139 |
| 2002 | 16.9 | 28.8 | 100 |
| 2003 | 72.5 | 121.1 | 417 |
| 2004 | 90.8 | 148 | 505 |
| 2005 | 75.6 | 119.6 | 404 |
| 2006 | 115.8 | 177.4 | 594 |
| 2007 | 166.3 | 248 | 822 |
| 2008 | 186.9 | 273 | 896 |
| 2009 | 145.7 | 210.7 | 686 |
| 2010 | 162.4 | 232.8 | 751 |
| 2011 | 158.8 | 223.2 | 715 |
| 2012 | 115.1 | 158.9 | 505 |
| 2013 | 82 | 111.2 | 351 |
| 2014 | 84.9 | 113 | 354 |
| 2015 | 63 | 83 | 258 |
| 2016 | 58.9 | 77 | 237 |
| 2017 | 82.5 | 106.1 | 324 |
| 2018 | 65.2 | 82 | 249 |
| 2019 | 68.8 | 85 | 257 |
| 2020 | 71.3 | 86.9 | 262 |
| 2021 | 68.5 | 80.8 | 243 |
Download SVG · CSV. Data and chart licensed CC BY 4.0.
Higgins Strategy. “Designated war funding peaked at $186.9 billion in FY2008” Exhibit 4, Every Dollar of War (Study IX). October 12, 2026. https://higginsstrategy.com/charts/09-05-war-funding-oco-2001-2021/