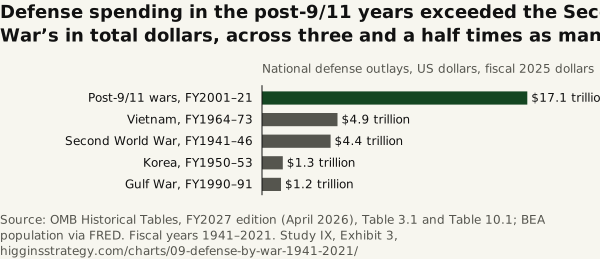
Defense spending in the post-9/11 years exceeded the Second World War’s in total dollars, across three and a half times as many years
Source. OMB Historical Tables, FY2027 edition (April 2026), Table 3.1 and Table 10.1; BEA population via FRED. Fiscal years 1941–2021.
Method and data
Method. National defense outlays summed over each war’s fiscal years in fiscal 2025 dollars: Second World War 1941–46, Korea 1950–53, Vietnam 1964–73, Gulf War 1990–91, post-9/11 wars 2001–21. The sums are whole defense budgets in those years, not the increment the war added, because the increment is a judgment and the budget is a record. Per resident today divides by the 2025 population (341,944 thousand). Cumulative figures sum fiscal 2025-dollar outlays and divide by the 2025 population; the per-resident-year averages sum each year’s per-resident figure. Neither is a measure of what any individual paid.
| War | Fiscal years | Defense outlays ($bn, FY2025) | Per resident today ($) |
|---|---|---|---|
| Second World War | 1941–46 | 4,425.8 | 12,943 |
| Korea | 1950–53 | 1,339.2 | 3,916 |
| Vietnam | 1964–73 | 4,870.7 | 14,244 |
| Gulf War | 1990–91 | 1,226.7 | 3,587 |
| Post-9/11 wars | 2001–21 | 17,118 | 50,061 |
Download SVG · CSV. Data and chart licensed CC BY 4.0.
Higgins Strategy. “Defense spending in the post-9/11 years exceeded the Second World War’s in total dollars, across three and a half times as many years” Exhibit 3, Every Dollar of War (Study IX). October 12, 2026. https://higginsstrategy.com/charts/09-defense-by-war-1941-2021/