Payroll in the District and Maryland, contracts in Virginia
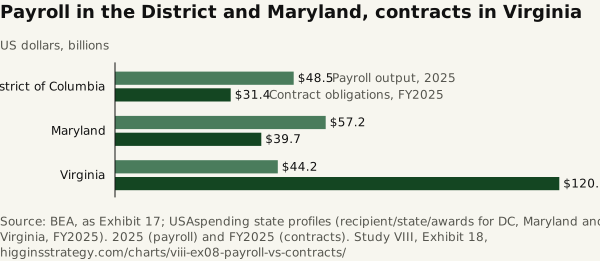
Source. BEA, as Exhibit 17; USAspending state profiles (recipient/state/awards for DC, Maryland and Virginia, FY2025). 2025 (payroll) and FY2025 (contracts).
Method and data
Method. Federal civilian payroll output in 2025 against federal contract obligations recorded to recipients in each state in FY2025. Virginia’s contract dollars are 2.7 times its payroll dollars ($120.6 billion ÷ $44.2 billion); the District’s and Maryland’s are below theirs. The two are not additive and contracts are counted where the recipient is registered, not where the work is done. FY2025 total prime awards fell in DC ($61.3 billion to $48.9 billion) and Maryland ($114.7 billion to $105.7 billion) and rose in Virginia ($189.1 billion to $214.2 billion).
| State | Payroll output, 2025 ($bn) | Contract obligations, FY2025 ($bn) |
|---|---|---|
| District of Columbia | 48.5 | 31.4 |
| Maryland | 57.2 | 39.7 |
| Virginia | 44.2 | 120.6 |
Download SVG · CSV. Data and chart licensed CC BY 4.0.
Higgins Strategy. “Payroll in the District and Maryland, contracts in Virginia” Exhibit 18, Every Federal Job in the Region (Study VIII). October 12, 2026. https://higginsstrategy.com/charts/viii-ex08-payroll-vs-contracts/