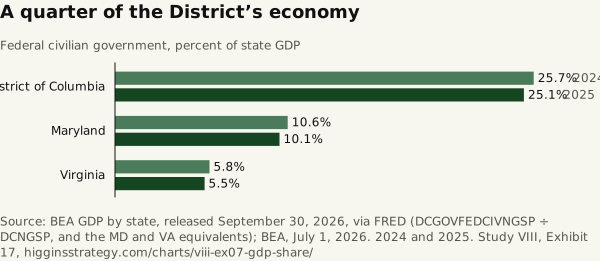
A quarter of the District’s economy
Source. BEA GDP by state, released September 30, 2026, via FRED (DCGOVFEDCIVNGSP ÷ DCNGSP, and the MD and VA equivalents); BEA, July 1, 2026. 2024 and 2025.
Method and data
Method. Federal civilian government as a share of state GDP in 2024 and 2025, in millions of current dollars as the inputs show. The shares fell in all three because the rest of each economy grew; the dollar values barely moved (DC +1.0 percent, Maryland −1.2, Virginia −0.3) because government output is measured by compensation and most of the departing workers were paid through September 2025. The first quarter of 2026 is where the money shows: BEA reports DC federal civilian earnings down $1.1 billion at an annual rate, the leading contributor to a 1.5 percent fall in DC earnings.
| State | 2024 (%) | 2025 (%) | Federal civilian 2024 ($m) | GDP 2024 ($m) | Federal civilian 2025 ($m) | GDP 2025 ($m) | Dollar change (%) |
|---|---|---|---|---|---|---|---|
| District of Columbia | 25.7 | 25.1 | 47,998.8 | 186,529.1 | 48,491.8 | 192,975.4 | 1 |
| Maryland | 10.6 | 10.1 | 57,893.3 | 545,117.5 | 57,178.4 | 567,018.5 | −1.2 |
| Virginia | 5.8 | 5.5 | 44,324.4 | 768,692.4 | 44,191.4 | 807,925 | −0.3 |
Download SVG · CSV. Data and chart licensed CC BY 4.0.
Higgins Strategy. “A quarter of the District’s economy” Exhibit 17, Every Federal Job in the Region (Study VIII). October 12, 2026. https://higginsstrategy.com/charts/viii-ex07-gdp-share/