What was forecast, and what the payroll shows
Method and data
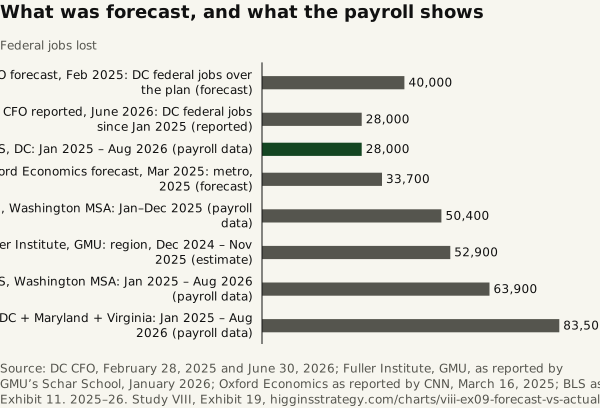
Method. Forecasts against outturns from the payroll data and official reporting. The DC CFO’s February 2025 letter projected 40,000 District federal jobs lost over the financial plan period; by June 2026 the CFO counted 28,000 — what the BLS District series shows — and called the trend in line with that forecast. Oxford Economics forecast 33,700 for the metro area in 2025; the MSA lost 50,400 from January to December 2025 (BLS, not seasonally adjusted, 375.8 thousand to 325.4 thousand), so the forecast was about two-thirds of the like-for-like outturn. The geographies differ: a “Washington” federal job loss can be 28,000, 64,000 or 83,500 depending on the boundary.
| Figure | Kind | Jobs lost |
|---|---|---|
| DC CFO forecast, Feb 2025: DC federal jobs over the plan | Forecast | 40,000 |
| DC CFO reported, June 2026: DC federal jobs since Jan 2025 | Reported | 28,000 |
| BLS, DC: Jan 2025 – Aug 2026 | Payroll data | 28,000 |
| Oxford Economics forecast, Mar 2025: metro, 2025 | Forecast | 33,700 |
| BLS, Washington MSA: Jan–Dec 2025 | Payroll data | 50,400 |
| Fuller Institute, GMU: region, Dec 2024 – Nov 2025 | Estimate | 52,900 |
| BLS, Washington MSA: Jan 2025 – Aug 2026 | Payroll data | 63,900 |
| BLS, DC + Maryland + Virginia: Jan 2025 – Aug 2026 | Payroll data | 83,500 |
Download SVG · CSV. Data and chart licensed CC BY 4.0.
Higgins Strategy. “What was forecast, and what the payroll shows” Exhibit 19, Every Federal Job in the Region (Study VIII). October 12, 2026. https://higginsstrategy.com/charts/viii-ex09-forecast-vs-actual/