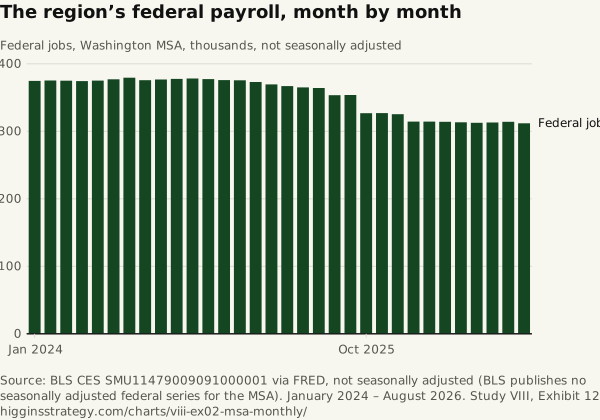
The region’s federal payroll, month by month
Source. BLS CES SMU11479009091000001 via FRED, not seasonally adjusted (BLS publishes no seasonally adjusted federal series for the MSA). January 2024 – August 2026.
Method and data
Method. Federal jobs in the Washington–Arlington–Alexandria metropolitan area, thousands. 375.8 thousand in January 2025; 353.8 in September; 326.8 in October 2025, the month the deferred-resignation cohort came off payroll; 311.9 in August 2026 — a fall of 63.9 thousand, 17.0 percent. The series has been flat at 312–314 thousand since January 2026.
| Month | Federal jobs (thousands) |
|---|---|
| January 2024 | 374.6 |
| February 2024 | 375.2 |
| March 2024 | 374.9 |
| April 2024 | 374.3 |
| May 2024 | 375.1 |
| June 2024 | 377 |
| July 2024 | 379.4 |
| August 2024 | 375.7 |
| September 2024 | 376.8 |
| October 2024 | 377.7 |
| November 2024 | 378.2 |
| December 2024 | 377.4 |
| January 2025 | 375.8 |
| February 2025 | 375.5 |
| March 2025 | 373 |
| April 2025 | 369.5 |
| May 2025 | 367 |
| June 2025 | 365.1 |
| July 2025 | 364.2 |
| August 2025 | 353.5 |
| September 2025 | 353.8 |
| October 2025 | 326.8 |
| November 2025 | 326.9 |
| December 2025 | 325.4 |
| January 2026 | 314.3 |
| February 2026 | 314.3 |
| March 2026 | 314 |
| April 2026 | 313.4 |
| May 2026 | 312.6 |
| June 2026 | 313 |
| July 2026 | 314 |
| August 2026 | 311.9 |
Download SVG · CSV. Data and chart licensed CC BY 4.0.
Higgins Strategy. “The region’s federal payroll, month by month” Exhibit 12, Every Federal Job in the Region (Study VIII). October 12, 2026. https://higginsstrategy.com/charts/viii-ex02-msa-monthly/