Maryland lost the largest share
Source. BLS Current Employment Statistics via FRED: CES9091000001 (US), SMS11000009091000001 (DC), SMS24000009091000001 (MD), SMS51000009091000001 (VA), SMU11479009091000001 (Washington MSA, not seasonally adjusted). Our arithmetic on the published series. January 2025 to August 2026 (US to September 2026).
Method and data
Method. Percentage change in federal government employment from January 2025 to the latest month, with the levels in thousands. Every series counts all federal jobs, Postal Service included. State figures cover whole states — Baltimore’s Social Security Administration, Aberdeen, Norfolk’s Navy yards — so the three together (549.9 to 466.4 thousand, −83.5 thousand) are a larger universe than the MSA, and neither is the “DMV” of common speech.
| Geography | Through | Jan 2025 (thousands) | Latest (thousands) | Change (thousands) | % change |
|---|---|---|---|---|---|
| Maryland | August 2026 | 162 | 132.7 | −29.3 | −18.1 |
| Washington MSA | August 2026 | 375.8 | 311.9 | −63.9 | −17 |
| District of Columbia | August 2026 | 192.2 | 164.2 | −28 | −14.6 |
| Virginia | August 2026 | 195.7 | 169.5 | −26.2 | −13.4 |
| United States | September 2026 | 3,010 | 2,682 | −328 | −10.9 |
Download SVG · CSV. Data and chart licensed CC BY 4.0.
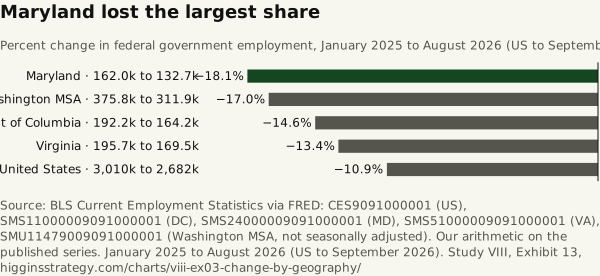
Higgins Strategy. “Maryland lost the largest share” Exhibit 13, Every Federal Job in the Region (Study VIII). October 12, 2026. https://higginsstrategy.com/charts/viii-ex03-change-by-geography/