The region fell faster than the country
Source. BLS Current Employment Statistics via FRED: CES9091000001 (US), SMS11000009091000001 (DC), SMS24000009091000001 (MD), SMS51000009091000001 (VA), SMU11479009091000001 (Washington MSA, not seasonally adjusted). January 2024 – September 2026 (states and MSA to August 2026).
Method and data
Method. Federal government employment indexed to January 2025, monthly from January 2024. States and the US seasonally adjusted; the Washington MSA is not seasonally adjusted because BLS publishes no adjusted federal series for it. CES counts jobs at establishments and includes the Postal Service. The national series ends in September 2026 at 89.1; the Washington MSA in August 2026 at 83.0; Maryland at 81.9; the District at 85.4; Virginia at 86.6. The step in October 2025 is the deferred-resignation cohort leaving payroll. The levels (thousands) are the cited ex01 file; the index columns are the cited ex01b.
| Month | US | Washington MSA | Maryland | District | Virginia |
|---|---|---|---|---|---|
| January 2024 | 98.7 | 99.7 | 98.9 | 100.7 | 97.6 |
| February 2024 | 99 | 99.8 | 99 | 100.6 | 98.2 |
| March 2024 | 99.3 | 99.8 | 99.3 | 100.5 | 98.2 |
| April 2024 | 99.4 | 99.6 | 99.6 | 100.5 | 98.2 |
| May 2024 | 99.7 | 99.8 | 99.8 | 100.6 | 98.6 |
| June 2024 | 99.8 | 100.3 | 99.9 | 100.7 | 98.8 |
| July 2024 | 99.9 | 101 | 100.2 | 101.2 | 98.9 |
| August 2024 | 100 | 100 | 100.2 | 100.7 | 99.2 |
| September 2024 | 100.1 | 100.3 | 100.1 | 100.5 | 99.2 |
| October 2024 | 100.1 | 100.5 | 100.3 | 100.1 | 99.6 |
| November 2024 | 100 | 100.6 | 100.2 | 99.8 | 99.8 |
| December 2024 | 100 | 100.4 | 100.2 | 100.1 | 99.9 |
| January 2025 | 100 | 100 | 100 | 100 | 100 |
| February 2025 | 99.6 | 99.9 | 99.9 | 99.7 | 99.7 |
| March 2025 | 99.3 | 99.3 | 98.5 | 100.1 | 98.1 |
| April 2025 | 98.9 | 98.3 | 97.3 | 99.6 | 97.7 |
| May 2025 | 98.1 | 97.7 | 96.1 | 99.4 | 97.2 |
| June 2025 | 97.8 | 97.2 | 94.7 | 99.1 | 96.9 |
| July 2025 | 97.5 | 96.9 | 94.1 | 98.5 | 96.7 |
| August 2025 | 96.9 | 94.1 | 91.2 | 96.8 | 96.3 |
| September 2025 | 96.8 | 94.1 | 90.7 | 96.6 | 96.1 |
| October 2025 | 91.3 | 87 | 84.8 | 88.7 | 89.3 |
| November 2025 | 90.8 | 87 | 84.6 | 88.7 | 89.3 |
| December 2025 | 90.4 | 86.6 | 84.1 | 88.3 | 88.7 |
| January 2026 | 89.2 | 83.6 | 82.4 | 86.6 | 87 |
| February 2026 | 89.3 | 83.6 | 82.3 | 86.4 | 87.7 |
| March 2026 | 89.1 | 83.6 | 82 | 86.1 | 87.3 |
| April 2026 | 89.1 | 83.4 | 82.2 | 85.6 | 87.3 |
| May 2026 | 89.2 | 83.2 | 82.2 | 85.5 | 87 |
| June 2026 | 89.2 | 83.3 | 82.3 | 85.5 | 87.1 |
| July 2026 | 89.2 | 83.6 | 82.3 | 85.6 | 86.8 |
| August 2026 | 89.1 | 83 | 81.9 | 85.4 | 86.6 |
| September 2026 | 89.1 |
Download SVG · CSV. Data and chart licensed CC BY 4.0.
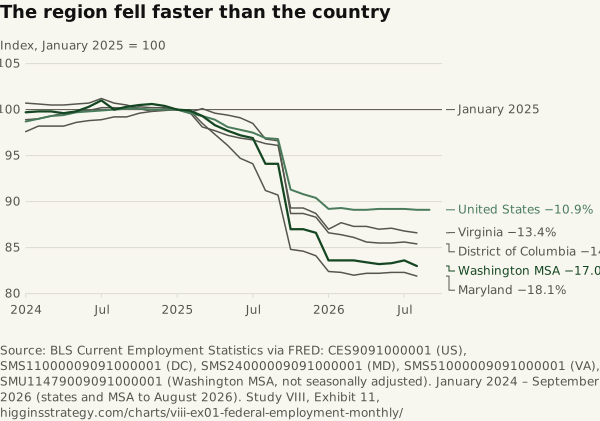
Higgins Strategy. “The region fell faster than the country” Exhibit 11, Every Federal Job in the Region (Study VIII). October 12, 2026. https://higginsstrategy.com/charts/viii-ex01-federal-employment-monthly/