From Study V · Part Three, Exhibit 9
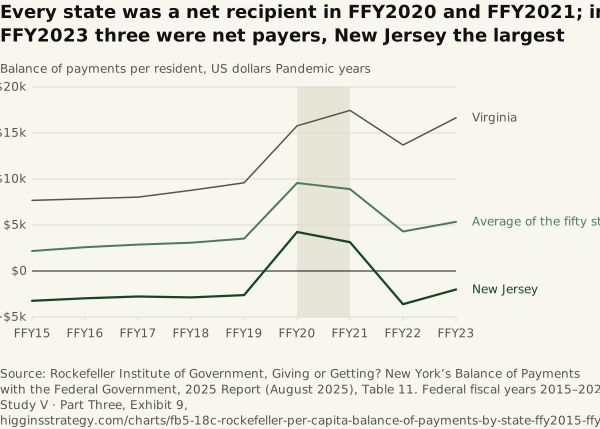
Every state was a net recipient in FFY2020 and FFY2021; in FFY2023 three were net payers, New Jersey the largest
Source. Rockefeller Institute of Government, Giving or Getting? New York’s Balance of Payments with the Federal Government, 2025 Report (August 2025), Table 11. Federal fiscal years 2015–2023.
Method and data
Method. Per-capita balance of payments: federal spending received minus federal receipts paid, per resident, FFY2015–FFY2023. Positive: the state gets more than it sends. The Rockefeller Institute’s series allocates all federal spending and all federal receipts to states, by economic incidence rather than by address. Rockefeller Institute of Government, “Giving or Getting? New York’s Balance of Payments with the Federal Government”, 2025 Report (August 2025), Table 11 (per-capita balance by state, FFY2015–FFY2023), transcribed in full; the FFY2023 column was checked against the report’s Table 6 with no mismatches. The line marked “average of the fifty states” is Table 11’s “US Average” row; the report’s Table 3 prints a different United States per capita balance (+$2,499 in FFY2019, +$8,869 in FFY2020, +$4,099 in FFY2023). Drawn: that average, Virginia (the highest in FFY2023) and New Jersey (the lowest); every state is in the table, sorted by its FFY2023 balance. The District of Columbia is not in the report.
| State | FFY2015 | FFY2019 | FFY2020 | FFY2021 | FFY2022 | FFY2023 | Swing, 2019–2021 |
|---|---|---|---|---|---|---|---|
| Virginia | +7,665 | +9,585 | +15,783 | +17,452 | +13,692 | +16,650 | +7,867 |
| New Mexico | +8,312 | +10,998 | +16,608 | +18,719 | +15,499 | +16,178 | +7,721 |
| Alaska | +4,678 | +8,745 | +14,992 | +15,773 | +13,449 | +14,760 | +7,028 |
| Maryland | +7,299 | +9,333 | +17,000 | +18,433 | +14,119 | +13,037 | +9,100 |
| West Virginia | +7,054 | +8,867 | +14,472 | +13,936 | +11,506 | +12,130 | +5,069 |
| Mississippi | +6,575 | +9,143 | +13,802 | +13,942 | +10,009 | +11,714 | +4,799 |
| Kentucky | +5,920 | +7,545 | +13,058 | +13,157 | +9,605 | +10,813 | +5,612 |
| Hawaii | +5,585 | +6,484 | +14,289 | +13,975 | +8,546 | +10,291 | +7,491 |
| Alabama | +6,346 | +8,250 | +12,493 | +12,495 | +9,241 | +10,268 | +4,245 |
| Maine | +4,839 | +7,105 | +12,487 | +10,918 | +7,497 | +9,144 | +3,813 |
| Louisiana | +2,962 | +5,317 | +12,333 | +13,034 | +7,635 | +8,784 | +7,717 |
| Oklahoma | +3,124 | +5,281 | +10,711 | +10,426 | +7,687 | +8,097 | +5,145 |
| South Carolina | +4,503 | +5,341 | +10,339 | +10,334 | +5,982 | +7,926 | +4,993 |
| Arkansas | +4,416 | +5,777 | +10,629 | +10,149 | +7,073 | +7,340 | +4,372 |
| Arizona | +3,336 | +5,002 | +12,223 | +9,838 | +5,441 | +7,195 | +4,836 |
| Missouri | +3,411 | +5,257 | +10,433 | +9,596 | +5,397 | +7,150 | +4,339 |
| Vermont | +2,747 | +3,523 | +11,162 | +9,933 | +5,418 | +5,558 | +6,410 |
| Delaware | +2,098 | +3,632 | +10,304 | +9,155 | +4,303 | +5,360 | +5,523 |
| Ohio | +2,083 | +3,164 | +9,189 | +8,455 | +4,170 | +5,075 | +5,291 |
| Montana | +3,049 | +4,550 | +10,103 | +9,107 | +4,791 | +4,929 | +4,557 |
| Pennsylvania | +1,516 | +2,991 | +9,896 | +8,834 | +3,590 | +4,826 | +5,843 |
| North Carolina | +2,914 | +3,733 | +8,756 | +8,151 | +4,324 | +4,808 | +4,418 |
| Rhode Island | +2,306 | +2,952 | +10,339 | +10,259 | +4,606 | +4,767 | +7,307 |
| Tennessee | +2,740 | +3,589 | +8,958 | +7,988 | +4,290 | +4,589 | +4,399 |
| Michigan | +1,911 | +2,997 | +10,101 | +8,667 | +3,953 | +4,584 | +5,670 |
| Indiana | +1,834 | +3,020 | +8,118 | +8,181 | +4,135 | +4,415 | +5,161 |
| Oregon | +1,895 | +2,304 | +8,240 | +7,678 | +3,125 | +4,389 | +5,374 |
| Idaho | +3,129 | +3,430 | +7,722 | +6,271 | +3,336 | +4,191 | +2,841 |
| Georgia | +2,072 | +2,645 | +8,770 | +8,862 | +2,980 | +3,951 | +6,217 |
| Kansas | +1,018 | +2,235 | +7,806 | +6,843 | +3,612 | +3,900 | +4,608 |
| South Dakota | +885 | +3,344 | +8,635 | +7,968 | +3,732 | +3,626 | +4,624 |
| Iowa | +1,063 | +2,428 | +7,810 | +7,589 | +2,594 | +3,481 | +5,161 |
| Wyoming | +566 | +2,532 | +7,779 | +6,173 | +1,727 | +3,218 | +3,641 |
| Connecticut | −1,863 | +819 | +7,944 | +4,881 | −305 | +2,937 | +4,062 |
| Wisconsin | +175 | +1,639 | +7,100 | +6,328 | +2,364 | +2,887 | +4,689 |
| North Dakota | −887 | +1,266 | +8,105 | +9,767 | +3,466 | +2,787 | +8,501 |
| Texas | +31 | +1,170 | +7,533 | +6,828 | +1,443 | +2,603 | +5,658 |
| Florida | +1,612 | +2,670 | +7,591 | +6,960 | +526 | +2,574 | +4,290 |
| Nebraska | −349 | +1,064 | +6,460 | +6,006 | +1,458 | +2,351 | +4,942 |
| Nevada | +1,235 | +1,669 | +8,269 | +7,274 | +302 | +2,120 | +5,605 |
| Utah | +158 | +142 | +4,297 | +2,997 | +184 | +1,067 | +2,855 |
| Colorado | −103 | +376 | +6,291 | +4,693 | −243 | +1,051 | +4,317 |
| Illinois | −1,339 | −267 | +6,191 | +6,790 | −361 | +818 | +7,057 |
| Minnesota | −1,070 | −525 | +5,977 | +4,886 | −721 | +807 | +5,411 |
| New York | −2,304 | −1,016 | +7,456 | +6,495 | −522 | +674 | +7,511 |
| California | −588 | −562 | +7,103 | +5,040 | −1,238 | +342 | +5,602 |
| New Hampshire | −886 | +910 | +6,295 | +2,893 | −1,339 | +23 | +1,983 |
| Washington | −122 | −126 | +5,094 | +3,592 | −1,642 | −7 | +3,718 |
| Massachusetts | −1,922 | −1,641 | +6,833 | +4,180 | −2,623 | −967 | +5,821 |
| New Jersey | −3,240 | −2,628 | +4,239 | +3,124 | −3,617 | −2,011 | +5,752 |
| Average of the fifty states | +2,168 | +3,521 | +9,562 | +8,900 | +4,284 | +5,344 | +5,379 |
Download fb5-18c-rockefeller-per-capita-balance-of-payments-by-state-ffy2015-ffy2023.csv
Download SVG · CSV. Data and chart licensed CC BY 4.0.
Higgins Strategy. “Every state was a net recipient in FFY2020 and FFY2021; in FFY2023 three were net payers, New Jersey the largest” Exhibit 9, Federal Dollars by State, Over Time (Study V · Part Three). October 12, 2026. https://higginsstrategy.com/charts/fb5-18c-rockefeller-per-capita-balance-of-payments-by-state-ffy2015-ffy2023/