From Study V · Part Three, Exhibit 10
Social Security and veterans’ spending follow age and veterans; grants and contracts do not follow poverty or income
Source. SSA Table 5.J1; VA GDX; MACPAC Exhibit 16; FNS; USAspending.gov; Census Bureau (Vintage 2025 ages; SAIPE); VA VetPop2023; BEA via FRED; 88 FR 81090; Rockefeller Institute. FY2025 awards; CY2024 Social Security; FY2024 VA and Medicaid; May 2025 SNAP; 2025 ages; 2023–2024 income; FFY2023 balance.
Method and data
Method. Eight scatter plots, one state per dot. Social Security per resident is SSA’s Table 5.J1 (estimated total annual OASDI benefits, 2024, by beneficiary address) ÷ the July 1, 2024 population; VA is FY2024 all expenditure by veteran’s address (GDX); Medicaid is the federal share, FY2024 (MACPAC Exhibit 16, CMS-64); SNAP is May 2025 × 12 (FNS); direct payments, grants and contracts are USAspending FY2025 by place of performance. Share 65 and over is from the Census Vintage 2025 single-year-of-age civilian population file (sc-est2025-agesex-civ), both sexes, July 1, 2025. Veterans are from VA’s VetPop2023 state projection at September 30, 2024, divided by July 2024 population. Poverty rate, all ages, is Census SAIPE 2024. Per capita personal income is BEA’s, via FRED: 2024 for the contracts panel, 2023 for the balance panel. FMAP FY2025 is from the Federal Register notice (88 FR 81090), with its statutory formula FMAP = 100 − 45 × (state PCI² / US PCI²), bounded at 50 and 83, DC fixed at 70. The balance of payments is Rockefeller’s FFY2023 (Table 11). Correlations are Pearson’s r over the states with both values, calculated by the firm from the plotted points (every input is in the table): Social Security vs share 65 and over, r = 0.90 (n = 51); direct payments, Medicare set aside, vs share 65 and over, r = 0.65, and as recorded, r = −0.06 (n = 50, DC excluded); VA vs veterans’ share, r = 0.91 (n = 50, DC excluded); federal Medicaid vs FMAP, r = 0.15 (n = 50, DC excluded), and FMAP vs per capita income, the three-year average 2020–2022 that the FY2025 formula uses (BEA via ALFRED, vintage of October 2, 2026), r = −0.94 (n = 50, DC excluded); SNAP vs poverty, r = 0.48 (n = 51); grants vs poverty, r = 0.09 (n = 50, DC excluded); contracts vs per capita income, 2024, r = 0.24 (n = 50, DC excluded); balance of payments vs per capita income, 2023, r = −0.53 (n = 50); and, cited in the text, all awards per resident, Medicare set aside, vs per capita income, 2024, r = 0.17 (n = 50, DC excluded). No line is fitted.
| State | Share 65 and over, 2025 (%) | Social Security per resident, 2024 | Direct payments, Medicare set aside, per resident, FY2025 | Direct payments, as recorded, per resident, FY2025 | Veterans, share of residents, September 2024 (%) | VA per resident, FY2024 | FMAP, FY2025 (%) | Federal Medicaid per resident, FY2024 | Per capita income, 2020–2022 average | Poverty rate, 2024 (%) | SNAP per resident, May 2025 × 12 | Grants per resident, FY2025 | Per capita income, 2024 | Contracts per resident, FY2025 | Per capita income, 2023 | Balance per resident, FFY2023 |
|---|---|---|---|---|---|---|---|---|---|---|---|---|---|---|---|---|
| Alaska | 16.23 | 3,333 | 8,252 | 8,252 | 9.51 | 1,632 | 51.54 | 2,964 | 65,605 | 10.3 | 387 | 11,296 | 76,842 | 5,225 | 72,563 | +14,760 |
| Alabama | 19.49 | 4,827 | 6,900 | 7,447 | 6.57 | 1,229 | 72.84 | 1,191 | 49,410 | 15.2 | 328 | 2,825 | 57,167 | 3,494 | 54,760 | +10,268 |
| Arkansas | 19.03 | 4,733 | 6,589 | 6,738 | 6.46 | 1,207 | 71.14 | 2,057 | 51,411 | 15.3 | 160 | 4,011 | 59,403 | 405 | 56,569 | +7,340 |
| Arizona | 20.66 | 4,483 | 6,401 | 8,254 | 6.22 | 976 | 64.89 | 2,037 | 56,056 | 11.9 | 254 | 3,374 | 65,563 | 3,062 | 63,159 | +7,195 |
| California | 17.60 | 3,502 | 5,232 | 6,386 | 3.62 | 650 | 50.00 | 2,466 | 74,820 | 11.8 | 319 | 4,366 | 86,761 | 1,576 | 81,318 | +342 |
| Colorado | 17.22 | 3,664 | 5,458 | 5,800 | 6.06 | 940 | 50.00 | 1,438 | 71,073 | 9.6 | 240 | 3,089 | 82,498 | 2,679 | 79,761 | +1,051 |
| Connecticut | 20.41 | 4,784 | 6,253 | 28,070 | 3.99 | 520 | 50.00 | 1,830 | 81,452 | 10.1 | 226 | 4,081 | 97,810 | 9,527 | 91,847 | +2,937 |
| District of Columbia | 13.68 | 2,633 | 4,948 | 5,240 | 3.94 | 1,830 | 70.00 | 4,627 | 96,417 | 16.4 | 461 | 19,932 | 115,442 | 45,307 | 107,332 | |
| Delaware | 22.84 | 5,591 | 7,221 | 7,268 | 5.96 | 818 | 60.15 | 2,133 | 59,830 | 10.1 | 242 | 3,914 | 65,328 | 347 | 63,773 | +5,360 |
| Florida | 22.85 | 4,780 | 6,695 | 10,003 | 6.00 | 1,071 | 57.17 | 898 | 61,518 | 12.1 | 274 | 2,117 | 74,880 | 1,383 | 71,123 | +2,574 |
| Georgia | 16.75 | 3,794 | 5,737 | 5,815 | 5.86 | 1,061 | 66.04 | 924 | 55,079 | 12.8 | 285 | 2,467 | 62,672 | 1,031 | 60,060 | +3,951 |
| Hawaii | 23.27 | 4,582 | 6,678 | 7,099 | 7.56 | 1,184 | 59.08 | 1,613 | 60,542 | 10.0 | 481 | 4,830 | 71,733 | 3,849 | 67,420 | +10,291 |
| Iowa | 20.06 | 4,728 | 6,444 | 6,480 | 5.48 | 758 | 63.25 | 1,950 | 57,442 | 11.2 | 167 | 3,640 | 64,920 | 1,116 | 62,669 | +3,481 |
| Idaho | 18.71 | 4,324 | 5,875 | 6,383 | 6.09 | 956 | 67.59 | 1,517 | 54,128 | 10.4 | 141 | 2,890 | 61,345 | 1,946 | 58,454 | +4,191 |
| Illinois | 18.74 | 4,087 | 5,694 | 6,428 | 4.75 | 589 | 51.38 | 1,628 | 65,544 | 11.5 | 348 | 3,165 | 75,507 | 977 | 72,309 | +818 |
| Indiana | 18.42 | 4,629 | 5,977 | 25,262 | 5.25 | 712 | 64.90 | 2,027 | 55,949 | 12.1 | 196 | 3,405 | 63,777 | 1,004 | 60,940 | +4,415 |
| Kansas | 18.98 | 4,515 | 6,524 | 6,609 | 5.99 | 877 | 61.87 | 1,120 | 58,782 | 10.9 | 133 | 2,573 | 65,693 | 1,203 | 63,304 | +3,900 |
| Kentucky | 18.91 | 4,603 | 6,373 | 30,207 | 5.63 | 1,003 | 71.48 | 3,118 | 50,541 | 15.4 | 276 | 5,081 | 58,270 | 2,263 | 55,618 | +10,813 |
| Louisiana | 18.86 | 4,139 | 6,123 | 6,937 | 5.46 | 945 | 68.06 | 2,833 | 53,554 | 18.6 | 389 | 4,936 | 61,201 | 1,030 | 58,671 | +8,784 |
| Massachusetts | 19.88 | 4,247 | 6,096 | 7,535 | 3.70 | 573 | 50.00 | 2,060 | 82,419 | 9.8 | 389 | 4,185 | 94,747 | 2,702 | 90,713 | −967 |
| Maryland | 18.44 | 4,060 | 5,803 | 6,080 | 5.64 | 850 | 50.00 | 1,764 | 68,356 | 9.2 | 234 | 4,434 | 79,558 | 6,334 | 75,673 | +13,037 |
| Maine | 24.58 | 5,476 | 7,682 | 8,310 | 7.42 | 1,190 | 62.06 | 2,257 | 58,440 | 10.6 | 242 | 4,441 | 68,600 | 2,776 | 65,138 | +9,144 |
| Michigan | 20.51 | 5,211 | 6,772 | 8,493 | 4.81 | 662 | 65.13 | 1,798 | 56,005 | 13.4 | 306 | 3,387 | 64,255 | 652 | 61,175 | +4,584 |
| Minnesota | 19.10 | 4,511 | 6,076 | 37,278 | 4.94 | 746 | 51.16 | 1,932 | 66,191 | 9.3 | 148 | 3,674 | 75,040 | 427 | 72,565 | +807 |
| Missouri | 19.67 | 4,673 | 6,335 | 9,451 | 6.16 | 1,035 | 65.31 | 1,860 | 55,882 | 12.2 | 246 | 3,234 | 66,746 | 2,228 | 63,466 | +7,150 |
| Mississippi | 19.41 | 4,701 | 6,729 | 6,729 | 6.10 | 1,061 | 76.90 | 1,890 | 45,540 | 17.8 | 260 | 3,566 | 51,611 | 2,709 | 49,698 | +11,714 |
| Montana | 22.23 | 4,825 | 7,142 | 7,142 | 7.66 | 1,319 | 62.37 | 1,672 | 58,313 | 10.4 | 144 | 5,047 | 68,809 | 1,001 | 65,336 | +4,929 |
| North Carolina | 19.10 | 4,536 | 6,432 | 6,683 | 6.17 | 1,183 | 65.06 | 1,994 | 56,065 | 12.6 | 257 | 3,961 | 65,247 | 834 | 61,953 | +4,808 |
| North Dakota | 18.07 | 3,999 | 6,873 | 116,853 | 5.98 | 923 | 50.97 | 1,180 | 65,893 | 10.8 | 150 | 4,905 | 73,125 | 1,027 | 72,066 | +2,787 |
| Nebraska | 18.31 | 4,123 | 6,572 | 9,516 | 5.86 | 973 | 57.52 | 1,228 | 62,375 | 10.6 | 162 | 3,535 | 72,368 | 627 | 71,114 | +2,351 |
| New Hampshire | 23.00 | 5,696 | 7,358 | 7,358 | 6.44 | 913 | 50.00 | 1,057 | 72,168 | 7.3 | 108 | 2,577 | 84,302 | 2,059 | 79,646 | +23 |
| New Jersey | 18.52 | 4,358 | 5,556 | 6,120 | 3.11 | 368 | 50.00 | 1,534 | 74,779 | 9.2 | 202 | 3,015 | 85,526 | 977 | 81,654 | −2,011 |
| New Mexico | 21.22 | 4,546 | 6,766 | 7,140 | 7.10 | 1,164 | 71.68 | 3,119 | 50,210 | 15.8 | 456 | 5,953 | 58,447 | 6,346 | 55,338 | +16,178 |
| Nevada | 18.32 | 3,943 | 5,785 | 6,063 | 6.38 | 1,221 | 60.22 | 1,385 | 59,507 | 11.8 | 312 | 3,032 | 70,490 | 1,228 | 67,120 | +2,120 |
| New York | 19.32 | 4,212 | 5,949 | 6,909 | 3.19 | 430 | 50.00 | 2,818 | 74,743 | 14.0 | 384 | 5,588 | 86,835 | 604 | 82,530 | +674 |
| Ohio | 20.16 | 4,458 | 6,019 | 6,433 | 5.52 | 783 | 64.60 | 2,072 | 56,267 | 12.6 | 272 | 3,569 | 64,569 | 826 | 61,623 | +5,075 |
| Oklahoma | 18.05 | 4,362 | 6,861 | 7,068 | 6.80 | 1,330 | 67.08 | 1,710 | 54,189 | 14.8 | 377 | 3,445 | 63,133 | 1,649 | 60,437 | +8,097 |
| Oregon | 21.03 | 4,832 | 6,711 | 7,998 | 6.09 | 998 | 59.00 | 2,803 | 61,008 | 11.7 | 396 | 4,751 | 70,225 | 487 | 66,911 | +4,389 |
| Pennsylvania | 21.44 | 5,117 | 6,667 | 15,810 | 5.11 | 667 | 55.09 | 2,057 | 63,186 | 11.6 | 327 | 3,691 | 71,486 | 2,063 | 68,474 | +4,826 |
| Rhode Island | 20.99 | 4,800 | 6,551 | 7,836 | 4.80 | 704 | 56.31 | 2,090 | 62,310 | 12.0 | 304 | 4,911 | 72,004 | 813 | 68,463 | +4,767 |
| South Carolina | 21.21 | 5,135 | 7,111 | 20,326 | 7.06 | 1,265 | 69.67 | 1,297 | 52,251 | 13.3 | 228 | 2,754 | 60,724 | 1,495 | 57,815 | +7,926 |
| South Dakota | 19.43 | 4,555 | 7,578 | 7,715 | 6.83 | 1,309 | 53.07 | 1,191 | 65,288 | 10.5 | 192 | 3,571 | 74,490 | 860 | 72,735 | +3,626 |
| Tennessee | 18.65 | 4,587 | 6,325 | 12,253 | 5.93 | 1,060 | 64.81 | 1,310 | 56,249 | 13.3 | 229 | 2,791 | 66,188 | 1,497 | 62,975 | +4,589 |
| Texas | 14.91 | 3,217 | 4,839 | 4,952 | 4.88 | 972 | 60.00 | 955 | 59,691 | 13.4 | 232 | 2,115 | 70,185 | 2,724 | 67,836 | +2,603 |
| Utah | 13.02 | 3,002 | 4,154 | 4,505 | 3.65 | 562 | 64.36 | 1,051 | 56,862 | 8.4 | 115 | 2,238 | 67,447 | 1,476 | 63,838 | +1,067 |
| Virginia | 18.61 | 4,274 | 6,253 | 7,324 | 7.69 | 1,242 | 50.99 | 1,626 | 66,079 | 9.8 | 198 | 3,180 | 77,492 | 13,578 | 74,000 | +16,650 |
| Vermont | 24.09 | 5,590 | 7,151 | 7,151 | 5.79 | 800 | 58.19 | 2,243 | 61,032 | 9.3 | 232 | 5,141 | 72,292 | 1,360 | 68,374 | +5,558 |
| Washington | 18.36 | 4,277 | 5,989 | 6,116 | 6.33 | 874 | 50.00 | 1,674 | 72,598 | 10.0 | 251 | 3,079 | 85,192 | 1,977 | 81,234 | −7 |
| Wisconsin | 20.79 | 5,065 | 6,535 | 15,117 | 5.36 | 795 | 60.43 | 1,310 | 59,347 | 10.3 | 226 | 2,731 | 68,240 | 1,049 | 64,945 | +2,887 |
| West Virginia | 22.55 | 5,662 | 7,706 | 7,706 | 6.84 | 1,451 | 73.84 | 2,243 | 47,950 | 16.2 | 312 | 4,692 | 54,970 | 1,063 | 52,526 | +12,130 |
| Wyoming | 20.75 | 4,905 | 7,504 | 7,504 | 7.64 | 1,444 | 50.00 | 803 | 71,473 | 10.0 | 102 | 3,458 | 88,089 | 844 | 83,470 | +3,218 |
Download SVG · CSV. Data and chart licensed CC BY 4.0.
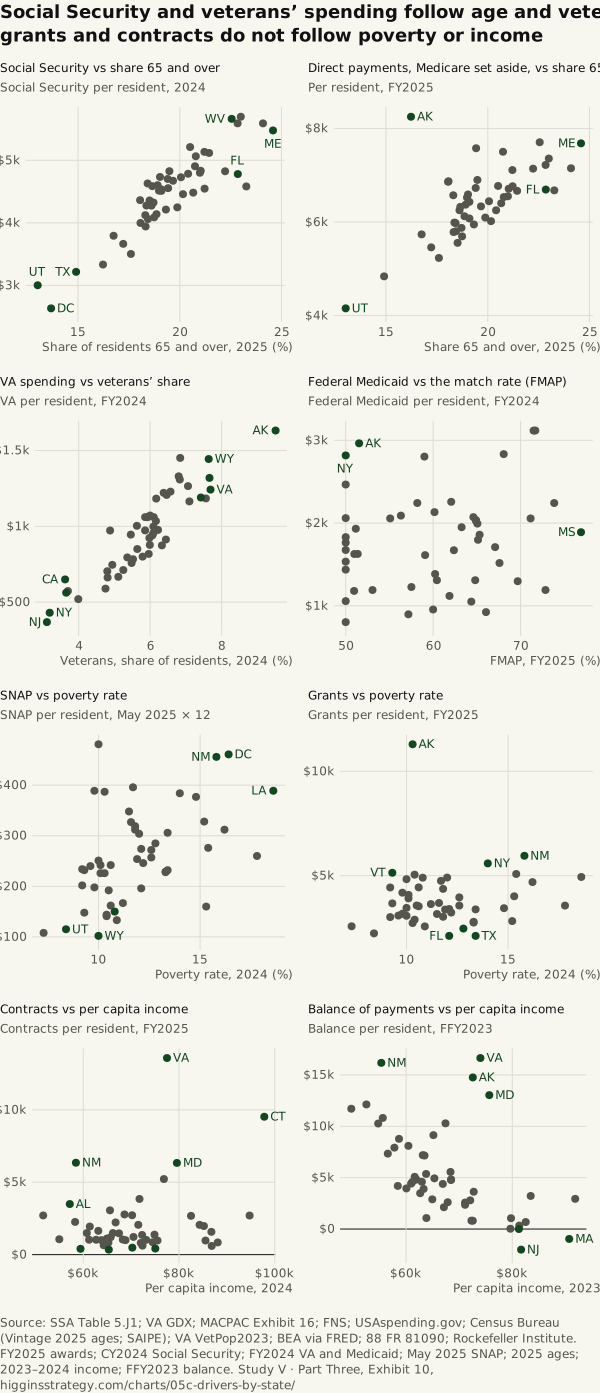
Higgins Strategy. “Social Security and veterans’ spending follow age and veterans; grants and contracts do not follow poverty or income” Exhibit 10, Federal Dollars by State, Over Time (Study V · Part Three). October 12, 2026. https://higginsstrategy.com/charts/05c-drivers-by-state/