From Study V · Part Three, Exhibit 8
From FY2019 to FY2021 awards per resident rose $11,322 in Alaska and $3,185 in Alabama, Medicare set aside
Source. USAspending.gov state profiles (prime award obligations by place of performance) and spending by geography (Medicare listings 93.773, 93.774, 93.770, by recipient location); Census Bureau population, July 1, via FRED. Fiscal years 2019 and 2021.
Method and data
Method. Change in awards per resident, FY2019 to FY2021, Medicare set aside, nominal dollars, one tile per state, shaded in three bins (under $4,000; $4,000–$5,000; $5,000 and over); the table sorts every state from the largest rise. The District of Columbia’s rise, $32,392 per resident, is in the top bin. Each rise is FY2021 per resident less FY2019 per resident, unrounded.
| State | FY2019 | FY2021 | Rise | Rise (%) |
|---|---|---|---|---|
| District of Columbia | 48,529 | 80,921 | 32,392 | 67 |
| Alaska | 14,096 | 25,418 | 11,322 | 80 |
| North Dakota | 8,455 | 16,526 | 8,072 | 95 |
| South Dakota | 9,034 | 15,653 | 6,620 | 73 |
| Wyoming | 7,921 | 14,507 | 6,586 | 83 |
| Louisiana | 8,179 | 14,489 | 6,311 | 77 |
| Minnesota | 7,131 | 13,416 | 6,285 | 88 |
| New Mexico | 13,109 | 19,298 | 6,189 | 47 |
| Vermont | 9,230 | 15,322 | 6,092 | 66 |
| Oklahoma | 7,970 | 13,961 | 5,990 | 75 |
| Hawaii | 8,584 | 14,451 | 5,867 | 68 |
| Massachusetts | 9,767 | 15,575 | 5,809 | 59 |
| New York | 8,817 | 14,568 | 5,751 | 65 |
| Arizona | 8,939 | 14,619 | 5,680 | 64 |
| Rhode Island | 8,726 | 14,380 | 5,654 | 65 |
| Virginia | 13,180 | 18,560 | 5,380 | 41 |
| Illinois | 6,762 | 11,967 | 5,205 | 77 |
| Kentucky | 9,968 | 15,034 | 5,066 | 51 |
| Montana | 9,138 | 14,187 | 5,049 | 55 |
| California | 7,238 | 12,207 | 4,969 | 69 |
| Delaware | 8,240 | 13,135 | 4,894 | 59 |
| Oregon | 7,985 | 12,834 | 4,849 | 61 |
| Nebraska | 6,975 | 11,666 | 4,691 | 67 |
| Texas | 6,929 | 11,593 | 4,664 | 67 |
| West Virginia | 10,017 | 14,585 | 4,568 | 46 |
| Maryland | 12,392 | 16,790 | 4,398 | 35 |
| Nevada | 6,784 | 11,121 | 4,338 | 64 |
| Colorado | 7,578 | 11,783 | 4,206 | 56 |
| Michigan | 7,830 | 11,975 | 4,145 | 53 |
| Iowa | 7,663 | 11,803 | 4,140 | 54 |
| Georgia | 6,531 | 10,664 | 4,133 | 63 |
| Kansas | 7,015 | 11,147 | 4,131 | 59 |
| Washington | 8,598 | 12,695 | 4,097 | 48 |
| Ohio | 7,379 | 11,460 | 4,081 | 55 |
| New Jersey | 6,974 | 11,016 | 4,042 | 58 |
| Tennessee | 8,011 | 12,047 | 4,036 | 50 |
| Connecticut | 12,429 | 16,412 | 3,983 | 32 |
| Pennsylvania | 8,887 | 12,832 | 3,945 | 44 |
| Wisconsin | 7,517 | 11,421 | 3,904 | 52 |
| Arkansas | 8,345 | 12,213 | 3,868 | 46 |
| South Carolina | 8,030 | 11,872 | 3,842 | 48 |
| North Carolina | 7,237 | 11,067 | 3,829 | 53 |
| Indiana | 7,452 | 11,264 | 3,812 | 51 |
| Maine | 10,756 | 14,508 | 3,752 | 35 |
| Florida | 7,547 | 11,245 | 3,697 | 49 |
| Mississippi | 10,116 | 13,707 | 3,591 | 36 |
| Missouri | 9,243 | 12,820 | 3,577 | 39 |
| Idaho | 7,610 | 11,049 | 3,439 | 45 |
| Utah | 5,258 | 8,664 | 3,406 | 65 |
| New Hampshire | 8,859 | 12,235 | 3,376 | 38 |
| Alabama | 10,322 | 13,508 | 3,185 | 31 |
Download SVG · CSV. Data and chart licensed CC BY 4.0.
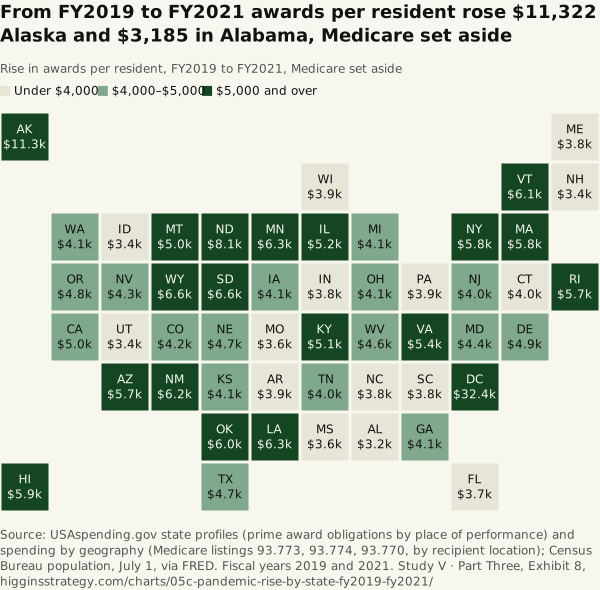
Higgins Strategy. “From FY2019 to FY2021 awards per resident rose $11,322 in Alaska and $3,185 in Alabama, Medicare set aside” Exhibit 8, Federal Dollars by State, Over Time (Study V · Part Three). October 12, 2026. https://higginsstrategy.com/charts/05c-pandemic-rise-by-state-fy2019-fy2021/