From Study V · Part Three, Exhibit 5
Alaska’s awards per resident grew fastest from FY2014 to FY2025, +140%, and Tennessee’s slowest, +55%, Medicare set aside
Source. USAspending.gov state profiles (prime award obligations by place of performance) and spending by geography (Medicare listings 93.773, 93.774, 93.770, by recipient location); Census Bureau population, July 1, via FRED. Fiscal years 2014–2025.
Method and data
Method. Each tile is a state’s awards per resident, Medicare set aside, FY2014 to FY2025, drawn as an index on one scale (each year’s value ÷ the state’s FY2014 value × 100), so the tiles compare growth; Alaska, the fastest, is in the accent. The index is the firm’s calculation from the dollar values in the table, which lists every state’s per-resident series and its change from FY2014 to FY2025, sorted from the largest change; the CSV adds contracts, direct payments and grants per resident, and the total as recorded. The District of Columbia is drawn on the same index (+77%); in dollars it is off any shared scale ($39,632 in FY2014, $70,232 in FY2025). Puerto Rico has no population series and no tile. The analysis window is FY2014–FY2025: before FY2014 the “other financial assistance” category swings by hundreds of billions between years in ways that reflect reporting practice, not spending (USAspending national sums: $1,279 billion in FY2011 and $63 billion in FY2014).
| State | Change, FY2014–FY2025 (%) | FY2014 | FY2019 | FY2021 | FY2025 |
|---|---|---|---|---|---|
| Alaska | 140.0 | 10,428 | 14,096 | 25,418 | 25,027 |
| Hawaii | 113.4 | 7,212 | 8,584 | 14,451 | 15,389 |
| Virginia | 108.6 | 11,047 | 13,180 | 18,560 | 23,047 |
| Connecticut | 105.9 | 9,632 | 12,429 | 16,412 | 19,832 |
| Kansas | 99.9 | 5,173 | 7,015 | 11,147 | 10,341 |
| Louisiana | 92.0 | 6,325 | 8,179 | 14,489 | 12,141 |
| North Dakota | 92.0 | 6,850 | 8,455 | 16,526 | 13,149 |
| Nevada | 91.9 | 5,248 | 6,784 | 11,121 | 10,074 |
| Wyoming | 91.5 | 6,202 | 7,921 | 14,507 | 11,876 |
| New Mexico | 90.9 | 10,027 | 13,109 | 19,298 | 19,137 |
| North Carolina | 90.5 | 5,939 | 7,237 | 11,067 | 11,312 |
| Montana | 88.6 | 7,116 | 9,138 | 14,187 | 13,422 |
| Maine | 88.1 | 7,941 | 10,756 | 14,508 | 14,939 |
| California | 85.8 | 6,021 | 7,238 | 12,207 | 11,189 |
| New Hampshire | 85.5 | 6,484 | 8,859 | 12,235 | 12,027 |
| Oregon | 83.6 | 6,592 | 7,985 | 12,834 | 12,104 |
| Arizona | 83.3 | 7,015 | 8,939 | 14,619 | 12,860 |
| Wisconsin | 83.2 | 5,638 | 7,517 | 11,421 | 10,330 |
| Oklahoma | 82.4 | 6,570 | 7,970 | 13,961 | 11,982 |
| Illinois | 81.2 | 5,435 | 6,762 | 11,967 | 9,850 |
| Texas | 81.0 | 5,366 | 6,929 | 11,593 | 9,712 |
| Vermont | 79.0 | 7,686 | 9,230 | 15,322 | 13,761 |
| Indiana | 78.3 | 5,838 | 7,452 | 11,264 | 10,411 |
| Iowa | 77.5 | 6,332 | 7,663 | 11,803 | 11,242 |
| District of Columbia | 77.2 | 39,632 | 48,529 | 80,921 | 70,232 |
| Florida | 76.8 | 5,965 | 7,547 | 11,245 | 10,544 |
| Nebraska | 75.2 | 6,171 | 6,975 | 11,666 | 10,810 |
| Pennsylvania | 74.3 | 7,123 | 8,887 | 12,832 | 12,417 |
| Mississippi | 73.9 | 7,505 | 10,116 | 13,707 | 13,055 |
| Utah | 73.6 | 4,537 | 5,258 | 8,664 | 7,875 |
| Delaware | 72.8 | 6,654 | 8,240 | 13,135 | 11,500 |
| Kentucky | 72.2 | 8,017 | 9,968 | 15,034 | 13,805 |
| Colorado | 72.1 | 6,544 | 7,578 | 11,783 | 11,264 |
| Ohio | 70.7 | 6,112 | 7,379 | 11,460 | 10,432 |
| New York | 70.0 | 7,146 | 8,817 | 14,568 | 12,150 |
| West Virginia | 68.7 | 8,001 | 10,017 | 14,585 | 13,499 |
| Maryland | 66.7 | 9,949 | 12,392 | 16,790 | 16,588 |
| South Carolina | 66.5 | 6,850 | 8,030 | 11,872 | 11,406 |
| Georgia | 66.2 | 5,589 | 6,531 | 10,664 | 9,290 |
| Michigan | 64.6 | 6,534 | 7,830 | 11,975 | 10,756 |
| Massachusetts | 64.4 | 7,906 | 9,767 | 15,575 | 12,998 |
| South Dakota | 64.0 | 7,417 | 9,034 | 15,653 | 12,162 |
| Alabama | 62.9 | 8,126 | 10,322 | 13,508 | 13,236 |
| Idaho | 62.5 | 6,622 | 7,610 | 11,049 | 10,763 |
| Missouri | 61.6 | 7,327 | 9,243 | 12,820 | 11,836 |
| Rhode Island | 61.2 | 7,631 | 8,726 | 14,380 | 12,301 |
| Minnesota | 59.6 | 6,472 | 7,131 | 13,416 | 10,328 |
| Arkansas | 58.2 | 6,999 | 8,345 | 12,213 | 11,072 |
| New Jersey | 57.2 | 6,074 | 6,974 | 11,016 | 9,548 |
| Washington | 55.9 | 7,097 | 8,598 | 12,695 | 11,065 |
| Tennessee | 55.4 | 6,863 | 8,011 | 12,047 | 10,666 |
Download fb5-18a-usaspending-awards-by-state-and-year-fy2014-fy2025.csv
Download SVG · CSV. Data and chart licensed CC BY 4.0.
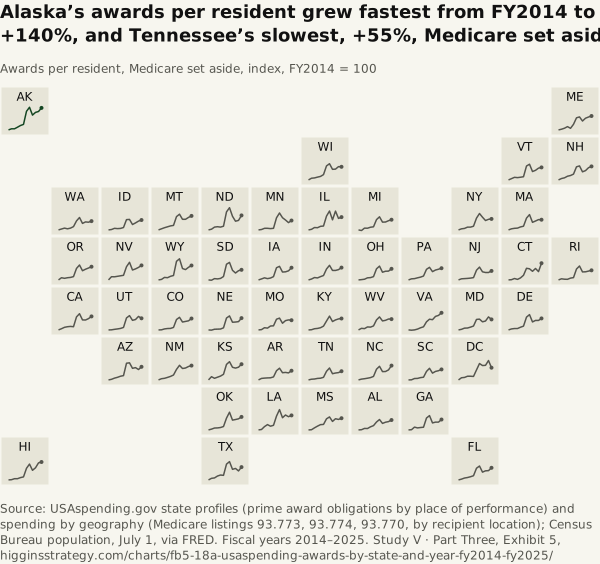
Higgins Strategy. “Alaska’s awards per resident grew fastest from FY2014 to FY2025, +140%, and Tennessee’s slowest, +55%, Medicare set aside” Exhibit 5, Federal Dollars by State, Over Time (Study V · Part Three). October 12, 2026. https://higginsstrategy.com/charts/fb5-18a-usaspending-awards-by-state-and-year-fy2014-fy2025/