From Study V · Part Three, Exhibit 4
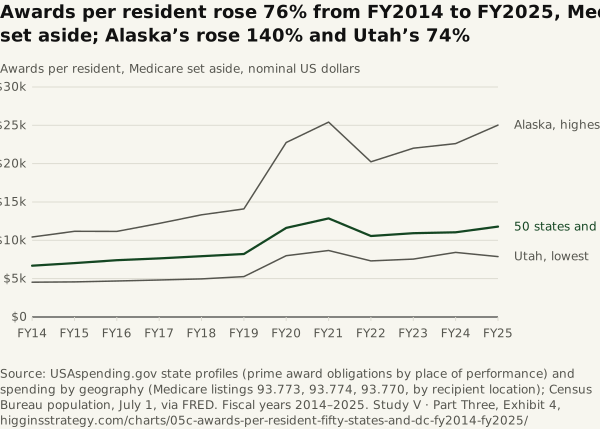
Awards per resident rose 76% from FY2014 to FY2025, Medicare set aside; Alaska’s rose 140% and Utah’s 74%
Source. USAspending.gov state profiles (prime award obligations by place of performance) and spending by geography (Medicare listings 93.773, 93.774, 93.770, by recipient location); Census Bureau population, July 1, via FRED. Fiscal years 2014–2025.
Method and data
Method. Per resident, in nominal dollars, FY2014 to FY2025: the 50 states and DC together ($2,127,048 million ÷ 318,386.3 thousand residents = $6,681 in FY2014; $4,026,681 million ÷ 341,784.9 thousand = $11,781 in FY2025), with the highest state (Alaska) and the lowest (Utah) in FY2025, Medicare set aside. The District of Columbia, at $70,232 in FY2025, is off this scale; every state’s series is in Exhibit 5 and its CSV. Fiscal year FY matches calendar year FY’s population (Census Bureau, July 1; Vintage 2025 for 2020 onward, earlier vintages for 2014–2019, via FRED). All series are in the dollars of their year. The CPI-U rose about 36 percent between FY2014 and FY2025 (BLS, fiscal-year averages of the monthly index, 236.008 and 319.997), so the national per-resident rise of 76% is roughly 30% in real terms (1.7635 ÷ 1.3559 − 1). The contract, direct-payment, grant and as-recorded figures for the 50 states and DC are in the table.
| Fiscal year | 50 states and DC | Alaska | Utah | 50 states and DC, contracts | 50 states and DC, direct payments, Medicare set aside | 50 states and DC, grants | 50 states and DC, all awards as recorded |
|---|---|---|---|---|---|---|---|
| 2014 | 6,681 | 10,428 | 4,537 | 1,273 | 3,372 | 1,821 | 8,482 |
| 2015 | 7,019 | 11,168 | 4,575 | 1,245 | 3,645 | 1,901 | 8,927 |
| 2016 | 7,410 | 11,161 | 4,695 | 1,343 | 3,788 | 2,031 | 9,479 |
| 2017 | 7,641 | 12,209 | 4,823 | 1,435 | 3,821 | 2,146 | 9,738 |
| 2018 | 7,922 | 13,328 | 4,966 | 1,552 | 3,891 | 2,222 | 10,019 |
| 2019 | 8,213 | 14,096 | 5,258 | 1,653 | 4,113 | 2,244 | 10,512 |
| 2020 | 11,619 | 22,756 | 7,985 | 1,879 | 5,084 | 2,786 | 14,297 |
| 2021 | 12,862 | 25,418 | 8,664 | 1,809 | 6,066 | 3,923 | 15,310 |
| 2022 | 10,561 | 20,244 | 7,310 | 1,916 | 5,053 | 3,290 | 13,212 |
| 2023 | 10,920 | 22,010 | 7,543 | 2,077 | 5,454 | 3,257 | 13,845 |
| 2024 | 11,047 | 22,613 | 8,420 | 2,046 | 5,546 | 3,417 | 14,052 |
| 2025 | 11,781 | 25,027 | 7,875 | 2,164 | 6,021 | 3,542 | 15,158 |
Download 05c-awards-per-resident-fifty-states-and-dc-fy2014-fy2025.csv
Download SVG · CSV. Data and chart licensed CC BY 4.0.
Higgins Strategy. “Awards per resident rose 76% from FY2014 to FY2025, Medicare set aside; Alaska’s rose 140% and Utah’s 74%” Exhibit 4, Federal Dollars by State, Over Time (Study V · Part Three). October 12, 2026. https://higginsstrategy.com/charts/05c-awards-per-resident-fifty-states-and-dc-fy2014-fy2025/