From Study V · Part Three, Exhibit 6
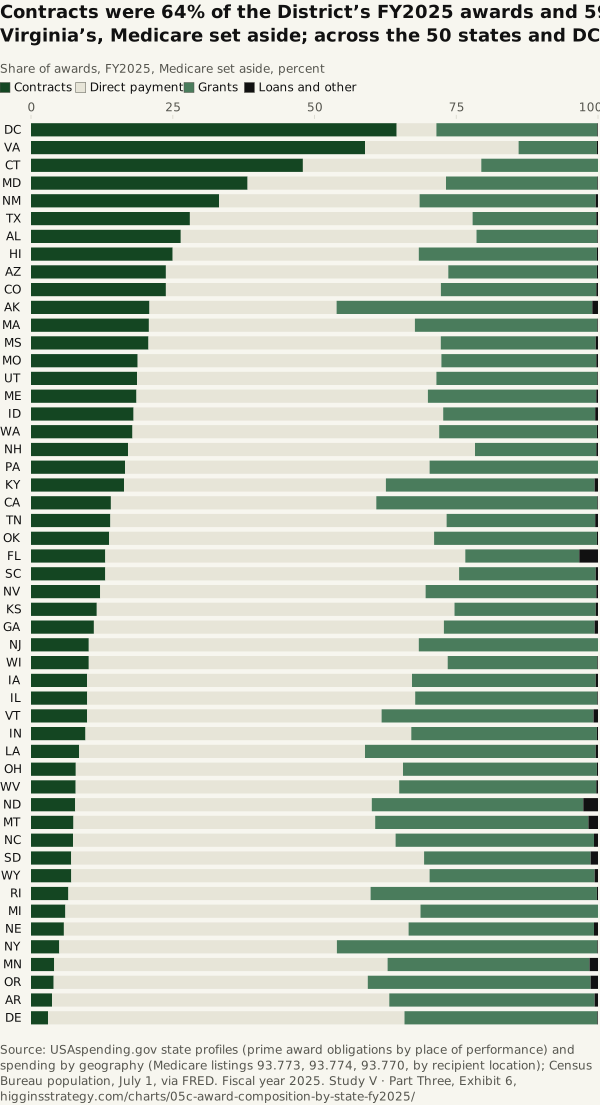
Contracts were 64% of the District’s FY2025 awards and 59% of Virginia’s, Medicare set aside; across the 50 states and DC, 18%
Source. USAspending.gov state profiles (prime award obligations by place of performance) and spending by geography (Medicare listings 93.773, 93.774, 93.770, by recipient location); Census Bureau population, July 1, via FRED. Fiscal year 2025.
Method and data
Method. The same FY2025 dollars, Medicare set aside, split into contracts, direct payments to people and governments, grants, and loans and other assistance, as shares of each state’s awards: one bar per state, ordered by the contract share. Across the 50 states and DC the split is 18% contracts, 51% direct payments, 30% grants. Direct payments in USAspending include payments to governments as well as to people: in FY2021, $350 billion of State and Local Fiscal Recovery Funds was recorded as a direct payment.
| State | Contracts | Direct payments | Grants | Loans and other |
|---|---|---|---|---|
| District of Columbia | 64.5 | 7.0 | 28.4 | 0.1 |
| Virginia | 58.9 | 27.1 | 13.8 | 0.2 |
| Connecticut | 48.0 | 31.5 | 20.6 | −0.1 |
| Maryland | 38.2 | 35.0 | 26.7 | 0.1 |
| New Mexico | 33.2 | 35.4 | 31.1 | 0.4 |
| Texas | 28.0 | 49.8 | 21.8 | 0.3 |
| Alabama | 26.4 | 52.1 | 21.3 | 0.1 |
| Hawaii | 25.0 | 43.4 | 31.4 | 0.2 |
| Arizona | 23.8 | 49.8 | 26.2 | 0.2 |
| Colorado | 23.8 | 48.5 | 27.4 | 0.3 |
| Alaska | 20.9 | 33.0 | 45.1 | 1.0 |
| Massachusetts | 20.8 | 46.9 | 32.2 | 0.1 |
| Mississippi | 20.7 | 51.5 | 27.3 | 0.4 |
| Missouri | 18.8 | 53.5 | 27.3 | 0.3 |
| Utah | 18.7 | 52.8 | 28.4 | 0.1 |
| Maine | 18.6 | 51.4 | 29.7 | 0.3 |
| Idaho | 18.1 | 54.6 | 26.8 | 0.5 |
| Washington | 17.9 | 54.1 | 27.8 | 0.2 |
| New Hampshire | 17.1 | 61.2 | 21.4 | 0.3 |
| Pennsylvania | 16.6 | 53.7 | 29.7 | 0.0 |
| Kentucky | 16.4 | 46.2 | 36.8 | 0.6 |
| California | 14.1 | 46.8 | 39.0 | 0.1 |
| Tennessee | 14.0 | 59.3 | 26.2 | 0.5 |
| Oklahoma | 13.8 | 57.3 | 28.7 | 0.2 |
| Florida | 13.1 | 63.5 | 20.1 | 3.3 |
| South Carolina | 13.1 | 62.4 | 24.1 | 0.4 |
| Nevada | 12.2 | 57.4 | 30.1 | 0.3 |
| Kansas | 11.6 | 63.1 | 24.9 | 0.4 |
| Georgia | 11.1 | 61.8 | 26.6 | 0.6 |
| New Jersey | 10.2 | 58.2 | 31.6 | 0.0 |
| Wisconsin | 10.2 | 63.3 | 26.4 | 0.1 |
| Iowa | 9.9 | 57.3 | 32.4 | 0.4 |
| Illinois | 9.9 | 57.8 | 32.1 | 0.1 |
| Vermont | 9.9 | 52.0 | 37.4 | 0.8 |
| Indiana | 9.6 | 57.4 | 32.7 | 0.2 |
| Louisiana | 8.5 | 50.4 | 40.7 | 0.4 |
| Ohio | 7.9 | 57.7 | 34.2 | 0.2 |
| West Virginia | 7.9 | 57.1 | 34.8 | 0.3 |
| North Dakota | 7.8 | 52.3 | 37.3 | 2.6 |
| Montana | 7.5 | 53.2 | 37.6 | 1.7 |
| North Carolina | 7.4 | 56.9 | 35.0 | 0.7 |
| South Dakota | 7.1 | 62.3 | 29.4 | 1.3 |
| Wyoming | 7.1 | 63.2 | 29.1 | 0.6 |
| Rhode Island | 6.6 | 53.3 | 39.9 | 0.2 |
| Michigan | 6.1 | 63.0 | 31.5 | −0.5 |
| Nebraska | 5.8 | 60.8 | 32.7 | 0.7 |
| New York | 5.0 | 49.0 | 46.0 | 0.1 |
| Minnesota | 4.1 | 58.8 | 35.6 | 1.5 |
| Oregon | 4.0 | 55.4 | 39.3 | 1.3 |
| Arkansas | 3.7 | 59.5 | 36.2 | 0.6 |
| Delaware | 3.0 | 62.8 | 34.0 | 0.1 |
Download SVG · CSV. Data and chart licensed CC BY 4.0.
Higgins Strategy. “Contracts were 64% of the District’s FY2025 awards and 59% of Virginia’s, Medicare set aside; across the 50 states and DC, 18%” Exhibit 6, Federal Dollars by State, Over Time (Study V · Part Three). October 12, 2026. https://higginsstrategy.com/charts/05c-award-composition-by-state-fy2025/