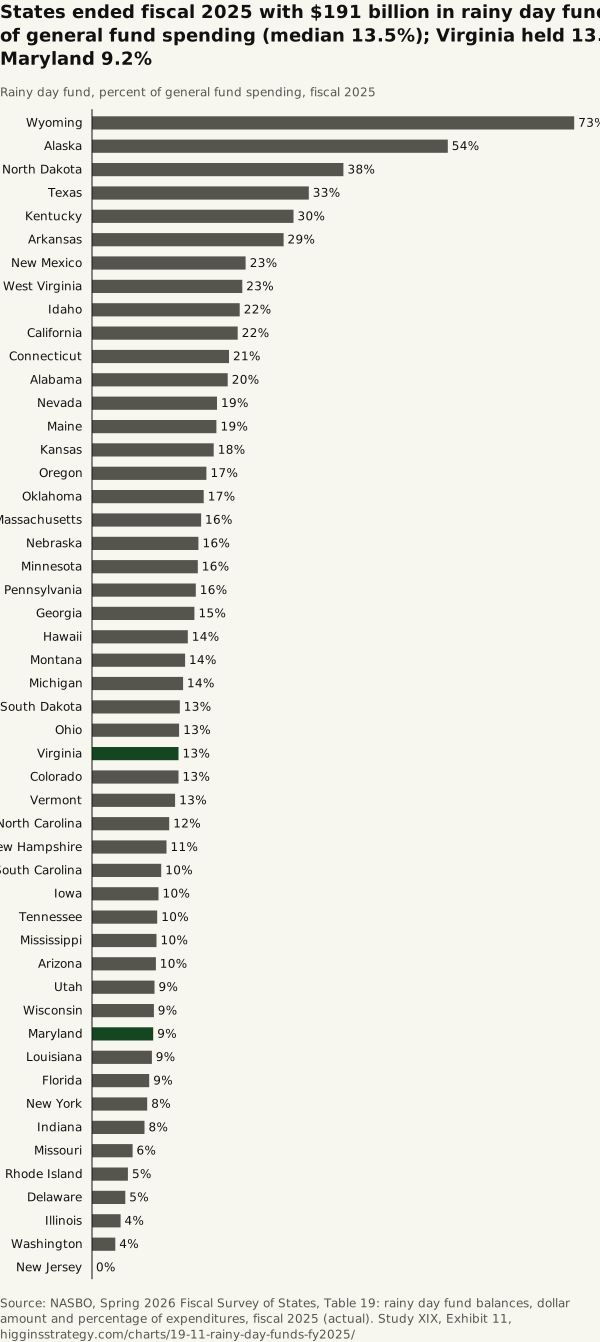
States ended fiscal 2025 with $191 billion in rainy day funds, 14.9% of general fund spending (median 13.5%); Virginia held 13.0%, Maryland 9.2%
Method and data
Method. Each state’s budget stabilization funds as the state defines them (NASBO lists the fund names), divided by that year’s general fund spending. Wyoming’s and Alaska’s large ratios are mineral-revenue reserves against small general funds. Ending general fund balances are a second cushion, carried in the table from NASBO’s Table 21. NASBO’s Table 19 projects the total at $182,725 million in fiscal 2026 and $160,454 million in fiscal 2027, $30,500 million below fiscal 2025; California’s fund goes from $50,225 million to $22,961 million, $27,264 million of that fall. Totals for 2026 and 2027 carry the latest figure for states that did not report.
| State | Rainy day fund, FY2025 ($ million) | Share of general fund spending (%) | FY2026 estimate (%) | Total balances incl. ending balance, FY2025 (%) | Rank |
|---|---|---|---|---|---|
| Wyoming | 1,626 | 72.5 | 70.3 | 75.6 | 1 |
| Alaska | 2,959 | 53.5 | 51.7 | 53.5 | 2 |
| North Dakota | 939 | 37.8 | 30.0 | 92.1 | 3 |
| Texas | 24,841 | 32.6 | 23.3 | 80.1 | 4 |
| Kentucky | 4,812 | 30.3 | 22.5 | 33.5 | 5 |
| Arkansas | 1,815 | 28.8 | 27.9 | 34.6 | 6 |
| New Mexico | 3,181 | 23.1 | 24.1 | 23.1 | 7 |
| West Virginia | 1,347 | 22.6 | 23.5 | 52.8 | 8 |
| Idaho | 1,195 | 22.2 | 21.3 | 28.0 | 9 |
| California | 50,225 | 21.9 | 17.4 | 34.1 | 10 |
| Connecticut | 4,827 | 20.6 | 18.8 | 20.6 | 11 |
| Alabama | 2,754 | 20.4 | 19.5 | 40.7 | 12 |
| Nevada | 1,244 | 18.8 | 18.5 | 41.4 | 13 |
| Maine | 1,030 | 18.7 | 13.2 | 21.5 | 14 |
| Kansas | 1,890 | 18.3 | 18.1 | 46.8 | 15 |
| Oregon | 2,923 | 17.2 | 17.1 | 29.9 | 16 |
| Oklahoma | 1,776 | 16.8 | 17.1 | 44.1 | 17 |
| Massachusetts | 8,524 | 16.4 | 15.8 | 27.0 | 18 |
| Nebraska | 877 | 16.0 | 15.2 | 30.5 | 19 |
| Minnesota | 5,395 | 15.9 | 10.6 | 30.2 | 20 |
| Pennsylvania | 7,473 | 15.6 | 15.5 | 24.3 | 21 |
| Georgia | 5,583 | 15.4 | n/a | 40.4 | 22 |
| Hawaii | 1,568 | 14.4 | 14.5 | 33.9 | 23 |
| Montana | 520 | 14.0 | 15.3 | 34.8 | 24 |
| Michigan | 2,157 | 13.7 | 13.1 | 15.7 | 25 |
| South Dakota | 323 | 13.2 | 12.4 | 20.2 | 26 |
| Ohio | 3,943 | 13.1 | 12.6 | 19.7 | 27 |
| Virginia | 4,750 | 13.0 | 12.4 | 13.0 | 28 |
| Colorado | 2,408 | 13.0 | 9.0 | 13.0 | 29 |
| Vermont | 328 | 12.5 | 18.2 | 22.3 | 30 |
| North Carolina | 3,623 | 11.6 | 11.1 | 14.4 | 31 |
| New Hampshire | 225 | 11.2 | 11.5 | 11.2 | 32 |
| South Carolina | 1,442 | 10.4 | 13.8 | 47.7 | 33 |
| Iowa | 891 | 10.0 | 9.0 | 31.0 | 34 |
| Tennessee | 2,150 | 9.8 | 8.5 | 26.1 | 35 |
| Mississippi | 678 | 9.7 | 9.9 | 9.8 | 36 |
| Arizona | 1,545 | 9.6 | 9.1 | 18.1 | 37 |
| Utah | 1,189 | 9.4 | 10.9 | 14.3 | 38 |
| Wisconsin | 1,991 | 9.3 | n/a | 30.7 | 39 |
| Maryland | 2,531 | 9.2 | 7.8 | 10.2 | 40 |
| Louisiana | 1,227 | 9.0 | 9.8 | 13.2 | 41 |
| Florida | 4,441 | 8.6 | 8.6 | 38.0 | 42 |
| New York | 8,756 | 8.3 | 7.7 | 54.2 | 43 |
| Indiana | 1,826 | 7.9 | 9.5 | 10.9 | 44 |
| Missouri | 955 | 6.1 | 5.8 | 33.6 | 45 |
| Rhode Island | 298 | 5.4 | 5.2 | 9.7 | 46 |
| Delaware | 349 | 5.0 | 5.1 | 42.2 | 47 |
| Illinois | 2,357 | 4.3 | 4.5 | 9.9 | 48 |
| Washington | 1,250 | 3.5 | 2.8 | 7.6 | 49 |
| New Jersey | 0 | 0.0 | 0.0 | 15.1 | 50 |
| All states | 190,954 | 14.9 | 31.7 |
Download SVG · CSV. Data and chart licensed CC BY 4.0.
Higgins Strategy. “States ended fiscal 2025 with $191 billion in rainy day funds, 14.9% of general fund spending (median 13.5%); Virginia held 13.0%, Maryland 9.2%” Exhibit 11, Every State Dollar (Study XIX). October 12, 2026. https://higginsstrategy.com/charts/19-11-rainy-day-funds-fy2025/