Fourteen states take more than the national share of their revenue from Washington and hold less than the median rainy day fund
Source. Census Bureau, Annual Survey of State Government Finances, fiscal 2024 (Exhibit 1); NASBO, Spring 2026 Fiscal Survey of States, Table 19 (Exhibit 11). Also: NASBO, Spring 2026 Fiscal Survey of States.
Method and data
Method. Each dot is a state. The national federal share is 34.2% (Exhibit 1) and the median rainy day fund 13.5% (Exhibit 11); the fourteen states, drawn in green, sit to the right of the first and below the second.
| State | Federal share of general revenue, FY2024 (%) | Rainy day fund, FY2025 (% of general fund spending) | Above national federal share and below median fund |
|---|---|---|---|
| Louisiana | 50.2 | 9.0 | yes |
| Alaska | 48.8 | 53.5 | |
| Arizona | 45.3 | 9.6 | yes |
| Kentucky | 44.3 | 30.3 | |
| Montana | 43.8 | 14.0 | |
| Missouri | 43.2 | 6.1 | yes |
| Mississippi | 42.0 | 9.7 | yes |
| South Dakota | 41.6 | 13.2 | yes |
| Indiana | 41.0 | 7.9 | yes |
| Oklahoma | 40.9 | 16.8 | |
| West Virginia | 40.6 | 22.6 | |
| Tennessee | 40.5 | 9.8 | yes |
| Wyoming | 40.1 | 72.5 | |
| New York | 39.5 | 8.3 | yes |
| Ohio | 39.2 | 13.1 | yes |
| Georgia | 38.1 | 15.4 | |
| Maine | 38.0 | 18.7 | |
| Arkansas | 38.0 | 28.8 | |
| Alabama | 37.8 | 20.4 | |
| Oregon | 36.9 | 17.2 | |
| Rhode Island | 36.8 | 5.4 | yes |
| Michigan | 36.3 | 13.7 | |
| North Carolina | 36.1 | 11.6 | yes |
| Pennsylvania | 36.0 | 15.6 | |
| Colorado | 36.0 | 13.0 | yes |
| Nebraska | 34.7 | 16.0 | |
| New Hampshire | 34.6 | 11.2 | yes |
| Florida | 34.4 | 8.6 | yes |
| Maryland | 33.9 | 9.2 | |
| Vermont | 33.8 | 12.5 | |
| Texas | 32.9 | 32.6 | |
| South Carolina | 32.8 | 10.4 | |
| Iowa | 32.6 | 10.0 | |
| Nevada | 31.9 | 18.8 | |
| Minnesota | 31.0 | 15.9 | |
| New Mexico | 30.9 | 23.1 | |
| Illinois | 30.4 | 4.3 | |
| Wisconsin | 30.3 | 9.3 | |
| Washington | 30.2 | 3.5 | |
| Massachusetts | 29.8 | 16.4 | |
| New Jersey | 29.8 | 0.0 | |
| Connecticut | 29.6 | 20.6 | |
| Delaware | 28.9 | 5.0 | |
| Idaho | 28.8 | 22.2 | |
| California | 28.0 | 21.9 | |
| Utah | 26.7 | 9.4 | |
| Virginia | 26.7 | 13.0 | |
| Kansas | 24.9 | 18.3 | |
| Hawaii | 24.0 | 14.4 | |
| North Dakota | 23.9 | 37.8 |
Download SVG · CSV. Data and chart licensed CC BY 4.0.
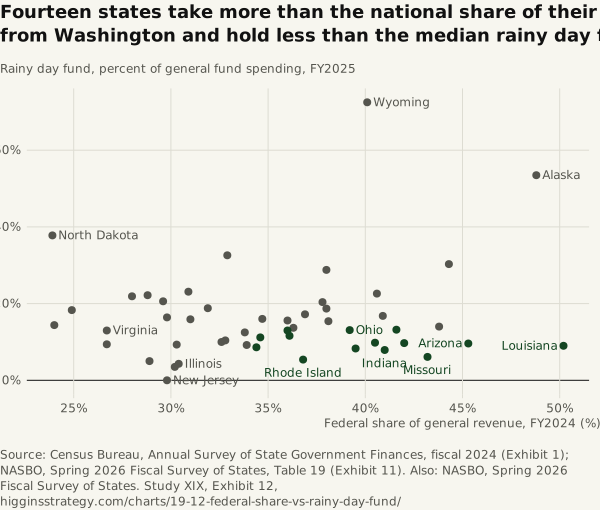
Higgins Strategy. “Fourteen states take more than the national share of their revenue from Washington and hold less than the median rainy day fund” Exhibit 12, Every State Dollar (Study XIX). October 12, 2026. https://higginsstrategy.com/charts/19-12-federal-share-vs-rainy-day-fund/