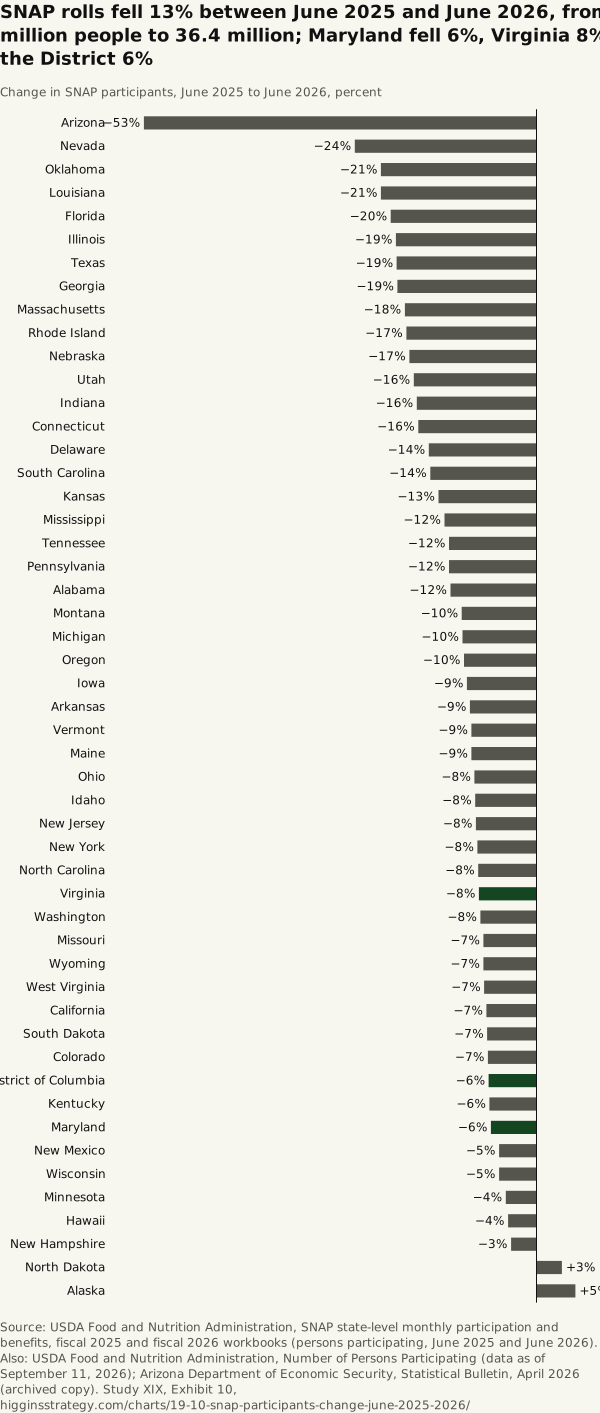
SNAP rolls fell 13% between June 2025 and June 2026, from 41.7 million people to 36.4 million; Maryland fell 6%, Virginia 8% and the District 6%
Source. USDA Food and Nutrition Administration, SNAP state-level monthly participation and benefits, fiscal 2025 and fiscal 2026 workbooks (persons participating, June 2025 and June 2026). Also: USDA Food and Nutrition Administration, Number of Persons Participating (data as of September 11, 2026); Arizona Department of Economic Security, Statistical Bulletin, April 2026 (archived copy).
Method and data
Method. Persons participating in the month, as reported by states to FNS; the most recent months are preliminary and are revised in later workbooks. The year spans the work-requirement and eligibility changes of P.L. 119-21 and the October–November 2025 lapse in appropriations, which disrupted November benefits. The size of the fall differs sharply by state. Arizona’s fall (−52.5%, the largest) is FNS’s own figure and matches the state’s report (Arizona DES Statistical Bulletin, April 2026: persons down 478,436, −52.4%, from a year earlier). June 2026 is FNS’s initial figure.
| State | Participants, June 2025 | June 2026 | Change (%) | Benefits, June 2026 ($ million) |
|---|---|---|---|---|
| Arizona | 886,806 | 421,147 | −52.5 | 77.9 |
| Nevada | 492,270 | 372,879 | −24.3 | 60.8 |
| Oklahoma | 691,754 | 547,574 | −20.8 | 99.0 |
| Louisiana | 791,032 | 626,575 | −20.8 | 118.4 |
| Florida | 2,928,850 | 2,358,796 | −19.5 | 391.8 |
| Illinois | 1,869,744 | 1,519,111 | −18.8 | 287.3 |
| Texas | 3,457,259 | 2,810,903 | −18.7 | 503.4 |
| Georgia | 1,469,381 | 1,196,489 | −18.6 | 223.4 |
| Massachusetts | 1,079,234 | 889,327 | −17.6 | 173.6 |
| Rhode Island | 141,801 | 117,128 | −17.4 | 22.7 |
| Nebraska | 149,699 | 124,299 | −17.0 | 22.3 |
| Utah | 174,386 | 145,780 | −16.4 | 27.8 |
| Indiana | 580,902 | 488,244 | −16.0 | 96.4 |
| Connecticut | 361,655 | 304,528 | −15.8 | 58.0 |
| Delaware | 118,766 | 101,658 | −14.4 | 18.0 |
| South Carolina | 570,687 | 489,699 | −14.2 | 91.0 |
| Kansas | 186,560 | 162,058 | −13.1 | 29.0 |
| Mississippi | 356,756 | 312,706 | −12.3 | 56.3 |
| Tennessee | 682,128 | 602,167 | −11.7 | 121.2 |
| Pennsylvania | 1,941,067 | 1,714,398 | −11.7 | 313.4 |
| Alabama | 732,974 | 648,952 | −11.5 | 124.5 |
| Montana | 80,066 | 72,094 | −10.0 | 12.6 |
| Michigan | 1,474,701 | 1,328,896 | −9.9 | 231.7 |
| Oregon | 772,310 | 697,500 | −9.7 | 124.8 |
| Iowa | 266,947 | 242,235 | −9.3 | 41.4 |
| Arkansas | 241,210 | 219,739 | −8.9 | 37.6 |
| Vermont | 64,094 | 58,520 | −8.7 | 11.4 |
| Maine | 163,056 | 148,906 | −8.7 | 26.3 |
| Ohio | 1,437,112 | 1,317,208 | −8.3 | 240.1 |
| Idaho | 132,534 | 121,642 | −8.2 | 22.0 |
| New Jersey | 821,038 | 754,543 | −8.1 | 147.4 |
| New York | 2,955,731 | 2,720,960 | −7.9 | 597.9 |
| North Carolina | 1,350,026 | 1,245,356 | −7.8 | 218.6 |
| Virginia | 813,228 | 750,364 | −7.7 | 123.1 |
| Washington | 903,442 | 835,317 | −7.5 | 153.0 |
| Missouri | 660,033 | 613,127 | −7.1 | 119.2 |
| Wyoming | 26,927 | 25,020 | −7.1 | 4.5 |
| West Virginia | 269,687 | 250,742 | −7.0 | 42.8 |
| California | 5,477,070 | 5,111,720 | −6.7 | 984.6 |
| South Dakota | 75,329 | 70,332 | −6.6 | 14.1 |
| Colorado | 614,911 | 574,650 | −6.5 | 111.8 |
| District of Columbia | 140,716 | 131,767 | −6.4 | 24.9 |
| Kentucky | 593,934 | 556,517 | −6.3 | 94.4 |
| Maryland | 665,084 | 624,548 | −6.1 | 114.9 |
| New Mexico | 458,019 | 435,290 | −5.0 | 76.6 |
| Wisconsin | 687,133 | 653,066 | −5.0 | 109.1 |
| Minnesota | 448,841 | 430,593 | −4.1 | 70.5 |
| Hawaii | 164,878 | 158,656 | −3.8 | 51.1 |
| New Hampshire | 75,489 | 72,932 | −3.4 | 12.3 |
| North Dakota | 51,179 | 52,904 | +3.4 | 9.4 |
| Alaska | 66,572 | 70,043 | +5.2 | 21.5 |
| United States | 41,674,903 | 36,352,716 | −12.8 | 6,781.0 |
Download SVG · CSV. Data and chart licensed CC BY 4.0.
Higgins Strategy. “SNAP rolls fell 13% between June 2025 and June 2026, from 41.7 million people to 36.4 million; Maryland fell 6%, Virginia 8% and the District 6%” Exhibit 10, Every State Dollar (Study XIX). October 12, 2026. https://higginsstrategy.com/charts/19-10-snap-participants-change-june-2025-2026/