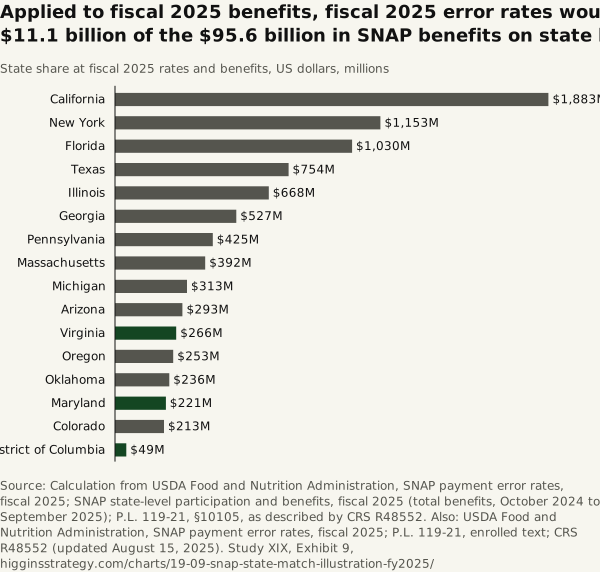
Applied to fiscal 2025 benefits, fiscal 2025 error rates would put $11.1 billion of the $95.6 billion in SNAP benefits on state budgets
Source. Calculation from USDA Food and Nutrition Administration, SNAP payment error rates, fiscal 2025; SNAP state-level participation and benefits, fiscal 2025 (total benefits, October 2024 to September 2025); P.L. 119-21, §10105, as described by CRS R48552. Also: USDA Food and Nutrition Administration, SNAP payment error rates, fiscal 2025; P.L. 119-21, enrolled text; CRS R48552 (updated August 15, 2025).
Method and data
Method. Each state’s fiscal 2025 benefit total multiplied by the match band its fiscal 2025 error rate falls in (0, 5, 10 or 15%). This is arithmetic, not a projection: the match begins in fiscal 2028, a state may elect its fiscal 2026 rate instead, benefit totals will differ by then, and states whose fiscal 2025 rate times 1.5 reaches 20% (Alaska, Delaware, District of Columbia, Georgia, Illinois, New Mexico, Oregon) are delayed to fiscal 2029; any state whose fiscal 2026 rate times 1.5 reaches 20% is delayed to 2030. The law separately raises states’ share of administrative costs from 50% to 75% from fiscal 2027; that is not in this table. The total is the fifty states and the District; FNS’s national figure, $95.8 billion, also counts Guam and the Virgin Islands.
| State | SNAP benefits, FY2025 ($ million) | Error rate, FY2025 (%) | Match band (%) | State share at these inputs ($ million) | Start on FY2025 rate |
|---|---|---|---|---|---|
| California | 12,552 | 10.93 | 15 | 1,883 | FY2028 |
| New York | 7,687 | 13.18 | 15 | 1,153 | FY2028 |
| Florida | 6,868 | 12.97 | 15 | 1,030 | FY2028 |
| Texas | 7,542 | 9.34 | 10 | 754 | FY2028 |
| Illinois | 4,456 | 14.67 | 15 | 668 | FY2029 or later |
| Georgia | 3,512 | 15.21 | 15 | 527 | FY2029 or later |
| Pennsylvania | 4,246 | 9.21 | 10 | 425 | FY2028 |
| Massachusetts | 2,617 | 12.49 | 15 | 392 | FY2028 |
| Michigan | 3,125 | 9.89 | 10 | 313 | FY2028 |
| Arizona | 1,956 | 10.80 | 15 | 293 | FY2028 |
| Virginia | 1,774 | 12.32 | 15 | 266 | FY2028 |
| Oregon | 1,685 | 14.14 | 15 | 253 | FY2029 or later |
| Oklahoma | 1,570 | 11.04 | 15 | 236 | FY2028 |
| Maryland | 1,474 | 13.08 | 15 | 221 | FY2028 |
| Colorado | 1,420 | 10.09 | 15 | 213 | FY2028 |
| Louisiana | 1,841 | 8.14 | 10 | 184 | FY2028 |
| Alabama | 1,730 | 9.52 | 10 | 173 | FY2028 |
| Tennessee | 1,711 | 9.44 | 10 | 171 | FY2028 |
| Ohio | 3,212 | 6.76 | 5 | 161 | FY2028 |
| Missouri | 1,564 | 8.67 | 10 | 156 | FY2028 |
| North Carolina | 3,069 | 7.36 | 5 | 153 | FY2028 |
| New Mexico | 996 | 16.81 | 15 | 149 | FY2029 or later |
| South Carolina | 1,414 | 8.80 | 10 | 141 | FY2028 |
| Indiana | 1,391 | 9.77 | 10 | 139 | FY2028 |
| Minnesota | 868 | 12.58 | 15 | 130 | FY2028 |
| Hawaii | 687 | 10.92 | 15 | 103 | FY2028 |
| Washington | 2,002 | 6.98 | 5 | 100 | FY2028 |
| New Jersey | 1,932 | 6.86 | 5 | 97 | FY2028 |
| Connecticut | 850 | 9.08 | 10 | 85 | FY2028 |
| Mississippi | 787 | 9.51 | 10 | 79 | FY2028 |
| Maine | 348 | 10.81 | 15 | 52 | FY2028 |
| Rhode Island | 342 | 12.42 | 15 | 51 | FY2028 |
| Nevada | 1,015 | 6.22 | 5 | 51 | FY2028 |
| Arkansas | 505 | 8.81 | 10 | 51 | FY2028 |
| District of Columbia | 325 | 18.66 | 15 | 49 | FY2029 or later |
| Kansas | 400 | 9.44 | 10 | 40 | FY2028 |
| Delaware | 260 | 16.00 | 15 | 39 | FY2029 or later |
| Alaska | 247 | 23.15 | 15 | 37 | FY2029 or later |
| West Virginia | 558 | 6.69 | 5 | 28 | FY2028 |
| Montana | 164 | 8.86 | 10 | 16 | FY2028 |
| New Hampshire | 153 | 8.85 | 10 | 15 | FY2028 |
| North Dakota | 129 | 9.89 | 10 | 13 | FY2028 |
| Wyoming | 60 | 3.96 | 0 | 0 | FY2028 |
| Wisconsin | 1,361 | 5.72 | 0 | 0 | FY2028 |
| Vermont | 150 | 5.38 | 0 | 0 | FY2028 |
| Utah | 409 | 5.54 | 0 | 0 | FY2028 |
| South Dakota | 179 | 2.47 | 0 | 0 | FY2028 |
| Nebraska | 328 | 5.90 | 0 | 0 | FY2028 |
| Kentucky | 1,271 | 4.70 | 0 | 0 | FY2028 |
| Iowa | 541 | 5.34 | 0 | 0 | FY2028 |
| Idaho | 286 | 3.85 | 0 | 0 | FY2028 |
| States and the District | 95,572 | 10.62 | 11,091 |
Download SVG · CSV. Data and chart licensed CC BY 4.0.
Higgins Strategy. “Applied to fiscal 2025 benefits, fiscal 2025 error rates would put $11.1 billion of the $95.6 billion in SNAP benefits on state budgets” Exhibit 9, Every State Dollar (Study XIX). October 12, 2026. https://higginsstrategy.com/charts/19-09-snap-state-match-illustration-fy2025/