The national SNAP payment error rate was 10.62% in fiscal 2025; 19 states and the District were at or above 10%, the top band of the new state match
Source. USDA Food and Nutrition Administration (formerly Food and Nutrition Service), SNAP payment error rates, fiscal 2025 (dated June 24, 2026) and fiscal 2024. Also: USDA Food and Nutrition Administration, SNAP payment error rates, fiscal 2024.
Method and data
Method. The payment error rate is the sum of overpayments and underpayments as a share of benefits issued, from the quality-control sample, with errors under $57 a case ignored in fiscal 2025. Under P.L. 119-21 the state match on benefits from fiscal 2028 is 0% below a 6% error rate, 5% from 6% to under 8%, 10% from 8% to under 10% and 15% at 10% or more. The table carries the bands and the fiscal 2024 rates.
| State | Error rate, FY2025 (%) | Overpayments (%) | Underpayments (%) | Error rate, FY2024 (%) | State match band from FY2028 (%) | Delayed on FY2025 rate (rate × 1.5 at least 20%) |
|---|---|---|---|---|---|---|
| Alaska | 23.15 | 20.58 | 2.57 | 24.66 | 15 | yes |
| District of Columbia | 18.66 | 15.33 | 3.33 | 17.38 | 15 | yes |
| New Mexico | 16.81 | 15.76 | 1.06 | 14.61 | 15 | yes |
| Delaware | 16.00 | 14.55 | 1.45 | 12.37 | 15 | yes |
| Georgia | 15.21 | 13.62 | 1.59 | 15.65 | 15 | yes |
| Illinois | 14.67 | 13.33 | 1.33 | 11.56 | 15 | yes |
| Oregon | 14.14 | 13.88 | 0.26 | 14.06 | 15 | yes |
| New York | 13.18 | 12.06 | 1.12 | 14.09 | 15 | |
| Maryland | 13.08 | 10.89 | 2.19 | 13.64 | 15 | |
| Florida | 12.97 | 11.54 | 1.43 | 15.13 | 15 | |
| Minnesota | 12.58 | 9.86 | 2.72 | 8.98 | 15 | |
| Massachusetts | 12.49 | 11.83 | 0.66 | 14.10 | 15 | |
| Rhode Island | 12.42 | 11.63 | 0.79 | 12.29 | 15 | |
| Virginia | 12.32 | 10.30 | 2.02 | 11.50 | 15 | |
| Oklahoma | 11.04 | 9.63 | 1.41 | 10.87 | 15 | |
| California | 10.93 | 10.06 | 0.87 | 10.98 | 15 | |
| Hawaii | 10.92 | 9.94 | 0.98 | 6.68 | 15 | |
| Maine | 10.81 | 9.33 | 1.48 | 10.26 | 15 | |
| Arizona | 10.80 | 8.63 | 2.16 | 8.84 | 15 | |
| Colorado | 10.09 | 8.52 | 1.57 | 9.97 | 15 | |
| North Dakota | 9.89 | 7.48 | 2.40 | 7.91 | 10 | |
| Michigan | 9.89 | 8.66 | 1.23 | 9.53 | 10 | |
| Indiana | 9.77 | 7.73 | 2.04 | 9.52 | 10 | |
| Alabama | 9.52 | 8.82 | 0.70 | 8.32 | 10 | |
| Mississippi | 9.51 | 7.57 | 1.94 | 10.69 | 10 | |
| Tennessee | 9.44 | 7.84 | 1.60 | 9.47 | 10 | |
| Kansas | 9.44 | 8.46 | 0.98 | 9.98 | 10 | |
| Texas | 9.34 | 6.99 | 2.35 | 8.32 | 10 | |
| Pennsylvania | 9.21 | 8.03 | 1.18 | 10.76 | 10 | |
| Connecticut | 9.08 | 7.43 | 1.65 | 10.25 | 10 | |
| Montana | 8.86 | 7.51 | 1.35 | 8.89 | 10 | |
| New Hampshire | 8.85 | 6.15 | 2.70 | 7.57 | 10 | |
| Arkansas | 8.81 | 7.97 | 0.84 | 9.56 | 10 | |
| South Carolina | 8.80 | 7.83 | 0.97 | 9.25 | 10 | |
| Missouri | 8.67 | 8.24 | 0.43 | 9.42 | 10 | |
| Louisiana | 8.14 | 6.84 | 1.30 | 6.62 | 10 | |
| North Carolina | 7.36 | 5.76 | 1.60 | 10.21 | 5 | |
| Washington | 6.98 | 6.15 | 0.83 | 6.06 | 5 | |
| New Jersey | 6.86 | 4.81 | 2.05 | 14.33 | 5 | |
| Ohio | 6.76 | 5.10 | 1.66 | 9.01 | 5 | |
| West Virginia | 6.69 | 6.22 | 0.46 | 9.43 | 5 | |
| Nevada | 6.22 | 5.69 | 0.53 | 5.94 | 5 | |
| Nebraska | 5.90 | 4.82 | 1.08 | 5.50 | 0 | |
| Wisconsin | 5.72 | 5.32 | 0.40 | 4.47 | 0 | |
| Utah | 5.54 | 4.64 | 0.89 | 5.74 | 0 | |
| Vermont | 5.38 | 5.06 | 0.32 | 5.13 | 0 | |
| Iowa | 5.34 | 4.63 | 0.71 | 6.14 | 0 | |
| Kentucky | 4.70 | 4.02 | 0.67 | 9.11 | 0 | |
| Wyoming | 3.96 | 3.55 | 0.41 | 5.12 | 0 | |
| Idaho | 3.85 | 3.45 | 0.40 | 3.59 | 0 | |
| South Dakota | 2.47 | 2.05 | 0.42 | 3.28 | 0 | |
| United States | 10.62 | 9.28 | 1.33 | 10.93 |
Download SVG · CSV. Data and chart licensed CC BY 4.0.
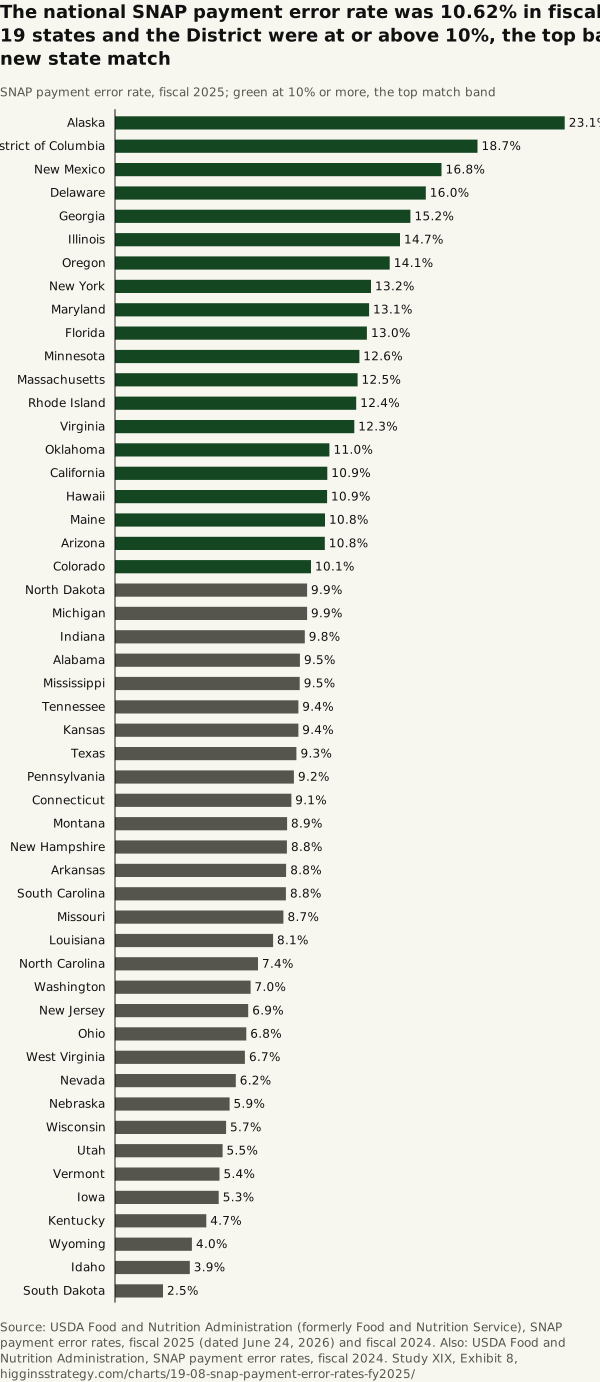
Higgins Strategy. “The national SNAP payment error rate was 10.62% in fiscal 2025; 19 states and the District were at or above 10%, the top band of the new state match” Exhibit 8, Every State Dollar (Study XIX). October 12, 2026. https://higginsstrategy.com/charts/19-08-snap-payment-error-rates-fy2025/