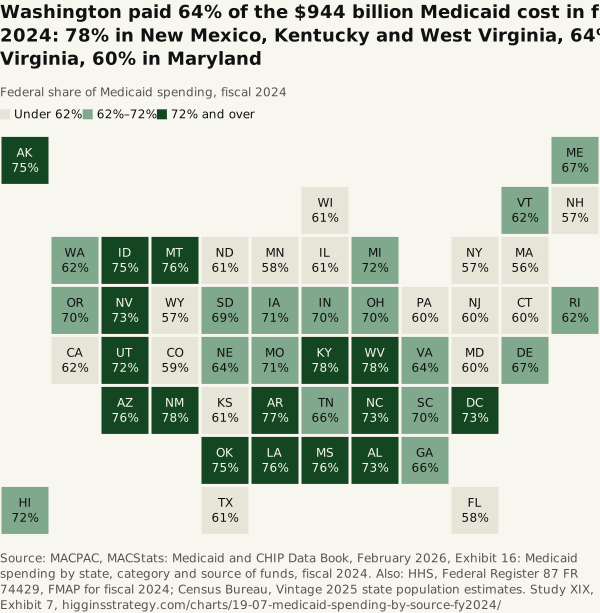
Washington paid 64% of the $944 billion Medicaid cost in fiscal 2024: 78% in New Mexico, Kentucky and West Virginia, 64% in Virginia, 60% in Maryland
Source. MACPAC, MACStats: Medicaid and CHIP Data Book, February 2026, Exhibit 16: Medicaid spending by state, category and source of funds, fiscal 2024. Also: HHS, Federal Register 87 FR 74429, FMAP for fiscal 2024; Census Bureau, Vintage 2025 state population estimates.
Method and data
Method. Benefits and state program administration together, federal over total. The federal share of benefits follows each state’s matching rate, which rises as state income per person falls and has a 50% floor; the 90% match for the adults covered by the 2014 expansion lifts the blended share in expansion states. This is the federal share of spending, not the matching rate: Mississippi’s share is 76% and its fiscal 2024 matching rate, the highest, 77%. Medicaid per resident, on Census’s July 1, 2024 populations: Virginia $22,354 million ÷ 8,819,642 = $2,535; the states and the District $943,817 million ÷ 340,003,797 = $2,776.
| State | Total Medicaid, FY2024 ($ million) | Federal ($ million) | State ($ million) | Federal share (%) | Rank |
|---|---|---|---|---|---|
| New Mexico | 8,490 | 6,633 | 1,857 | 78.1 | 1 |
| Kentucky | 18,302 | 14,295 | 4,008 | 78.1 | 2 |
| West Virginia | 5,111 | 3,965 | 1,146 | 77.6 | 3 |
| Arkansas | 8,313 | 6,370 | 1,943 | 76.6 | 4 |
| Louisiana | 17,180 | 13,076 | 4,104 | 76.1 | 5 |
| Montana | 2,504 | 1,902 | 602 | 76.0 | 6 |
| Mississippi | 7,357 | 5,576 | 1,781 | 75.8 | 7 |
| Arizona | 20,388 | 15,391 | 4,998 | 75.5 | 8 |
| Alaska | 2,904 | 2,183 | 721 | 75.2 | 9 |
| Oklahoma | 9,325 | 7,005 | 2,320 | 75.1 | 10 |
| Idaho | 4,051 | 3,035 | 1,015 | 74.9 | 11 |
| Alabama | 8,402 | 6,151 | 2,252 | 73.2 | 12 |
| District of Columbia | 4,372 | 3,199 | 1,173 | 73.2 | 13 |
| Nevada | 6,176 | 4,507 | 1,669 | 73.0 | 14 |
| North Carolina | 30,213 | 22,041 | 8,173 | 73.0 | 15 |
| Utah | 5,104 | 3,683 | 1,421 | 72.2 | 16 |
| Michigan | 25,361 | 18,159 | 7,202 | 71.6 | 17 |
| Hawaii | 3,236 | 2,315 | 921 | 71.5 | 18 |
| Iowa | 8,874 | 6,300 | 2,574 | 71.0 | 19 |
| Missouri | 16,445 | 11,614 | 4,832 | 70.6 | 20 |
| Oregon | 16,993 | 11,954 | 5,039 | 70.3 | 21 |
| Indiana | 20,021 | 14,055 | 5,966 | 70.2 | 22 |
| Ohio | 35,203 | 24,573 | 10,630 | 69.8 | 23 |
| South Carolina | 10,240 | 7,121 | 3,119 | 69.5 | 24 |
| South Dakota | 1,600 | 1,104 | 496 | 69.0 | 25 |
| Maine | 4,732 | 3,179 | 1,553 | 67.2 | 26 |
| Delaware | 3,340 | 2,240 | 1,100 | 67.1 | 27 |
| Georgia | 15,577 | 10,348 | 5,229 | 66.4 | 28 |
| Tennessee | 14,345 | 9,499 | 4,846 | 66.2 | 29 |
| Virginia | 22,354 | 14,339 | 8,015 | 64.1 | 30 |
| Nebraska | 3,840 | 2,463 | 1,377 | 64.1 | 31 |
| Rhode Island | 3,725 | 2,321 | 1,404 | 62.3 | 32 |
| Washington | 21,318 | 13,275 | 8,043 | 62.3 | 33 |
| Vermont | 2,336 | 1,450 | 887 | 62.1 | 34 |
| California | 157,098 | 97,055 | 60,043 | 61.8 | 35 |
| Kansas | 5,413 | 3,322 | 2,091 | 61.4 | 36 |
| North Dakota | 1,526 | 936 | 590 | 61.3 | 37 |
| Illinois | 33,747 | 20,680 | 13,067 | 61.3 | 38 |
| Wisconsin | 12,771 | 7,804 | 4,967 | 61.1 | 39 |
| Texas | 49,398 | 29,905 | 19,494 | 60.5 | 40 |
| Pennsylvania | 44,432 | 26,841 | 17,591 | 60.4 | 41 |
| New Jersey | 24,217 | 14,580 | 9,637 | 60.2 | 42 |
| Maryland | 18,455 | 11,016 | 7,439 | 59.7 | 43 |
| Connecticut | 11,295 | 6,723 | 4,573 | 59.5 | 44 |
| Colorado | 14,674 | 8,614 | 6,060 | 58.7 | 45 |
| Florida | 35,906 | 20,902 | 15,004 | 58.2 | 46 |
| Minnesota | 19,329 | 11,201 | 8,127 | 57.9 | 47 |
| New York | 98,178 | 56,368 | 41,810 | 57.4 | 48 |
| New Hampshire | 2,622 | 1,489 | 1,133 | 56.8 | 49 |
| Wyoming | 831 | 471 | 360 | 56.7 | 50 |
| Massachusetts | 26,193 | 14,708 | 11,485 | 56.2 | 51 |
| States and the District | 943,817 | 607,936 | 335,887 | 64.4 |
Download SVG · CSV. Data and chart licensed CC BY 4.0.
Higgins Strategy. “Washington paid 64% of the $944 billion Medicaid cost in fiscal 2024: 78% in New Mexico, Kentucky and West Virginia, 64% in Virginia, 60% in Maryland” Exhibit 7, Every State Dollar (Study XIX). October 12, 2026. https://higginsstrategy.com/charts/19-07-medicaid-spending-by-source-fy2024/