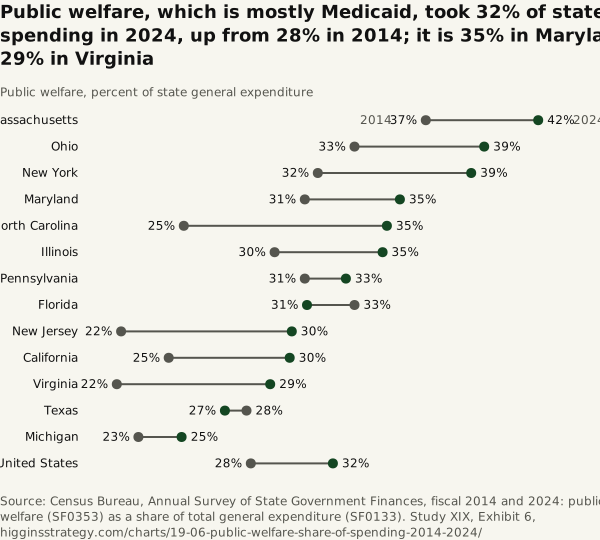
Public welfare, which is mostly Medicaid, took 32% of state general spending in 2024, up from 28% in 2014; it is 35% in Maryland and 29% in Virginia
Method and data
Method. Census’s public welfare category is dominated by Medicaid vendor payments and also holds cash assistance, SNAP administration and other social services; it counts the federal and the state dollars together. The twelve states are the largest by general expenditure. The table carries all fifty.
| State | Public welfare share, 2014 (%) | 2024 (%) | Change (points) | Public welfare, 2024 ($ million) |
|---|---|---|---|---|
| Kentucky | 31.8 | 43.1 | +11.4 | 20,541 |
| Maine | 43.0 | 42.5 | −0.5 | 5,698 |
| Arizona | 30.1 | 42.5 | +12.4 | 26,024 |
| Oklahoma | 32.5 | 42.4 | +9.9 | 14,576 |
| Massachusetts | 36.5 | 41.7 | +5.3 | 34,289 |
| Louisiana | 29.6 | 40.5 | +10.9 | 18,702 |
| Indiana | 32.3 | 39.9 | +7.6 | 22,965 |
| Ohio | 33.2 | 39.2 | +6.0 | 39,777 |
| Oregon | 29.0 | 38.6 | +9.6 | 20,471 |
| New York | 31.5 | 38.6 | +7.0 | 97,362 |
| Minnesota | 31.8 | 38.5 | +6.7 | 23,395 |
| Rhode Island | 36.3 | 37.4 | +1.1 | 4,554 |
| Maryland | 30.9 | 35.3 | +4.5 | 21,627 |
| North Carolina | 25.3 | 34.7 | +9.3 | 30,973 |
| Iowa | 27.9 | 34.6 | +6.7 | 10,257 |
| Illinois | 29.5 | 34.5 | +5.0 | 41,231 |
| Tennessee | 36.7 | 33.2 | −3.5 | 16,429 |
| Missouri | 31.3 | 33.1 | +1.8 | 15,673 |
| Arkansas | 29.5 | 33.0 | +3.5 | 8,670 |
| Pennsylvania | 30.9 | 32.8 | +1.9 | 39,383 |
| West Virginia | 31.6 | 32.7 | +1.1 | 6,245 |
| Montana | 25.8 | 32.6 | +6.8 | 2,902 |
| New Mexico | 27.3 | 32.1 | +4.8 | 10,720 |
| Florida | 33.2 | 31.0 | −2.2 | 40,146 |
| Nebraska | 27.0 | 30.6 | +3.7 | 4,970 |
| New Jersey | 22.4 | 30.3 | +7.9 | 28,076 |
| Wisconsin | 27.4 | 30.2 | +2.8 | 16,262 |
| California | 24.6 | 30.2 | +5.6 | 156,706 |
| Mississippi | 31.2 | 30.0 | −1.3 | 8,088 |
| Virginia | 22.2 | 29.3 | +7.1 | 23,677 |
| Delaware | 26.5 | 29.2 | +2.6 | 3,974 |
| Vermont | 28.9 | 28.4 | −0.5 | 2,692 |
| Colorado | 23.2 | 28.4 | +5.2 | 13,624 |
| South Carolina | 28.8 | 27.3 | −1.5 | 12,847 |
| Texas | 28.2 | 27.2 | −1.0 | 57,360 |
| Nevada | 19.6 | 27.1 | +7.4 | 6,624 |
| New Hampshire | 20.8 | 27.1 | +6.2 | 2,731 |
| Georgia | 28.7 | 26.9 | −1.8 | 18,989 |
| South Dakota | 24.5 | 26.8 | +2.3 | 1,956 |
| Alaska | 17.7 | 26.4 | +8.8 | 3,269 |
| Idaho | 30.7 | 25.7 | −4.9 | 3,731 |
| Michigan | 23.2 | 25.2 | +2.0 | 24,405 |
| Washington | 24.1 | 24.6 | +0.6 | 19,624 |
| Kansas | 23.9 | 24.5 | +0.7 | 6,847 |
| Hawaii | 24.5 | 22.6 | −1.9 | 4,179 |
| Alabama | 28.1 | 22.3 | −5.8 | 9,738 |
| North Dakota | 16.0 | 21.8 | +5.9 | 2,093 |
| Utah | 21.2 | 21.4 | +0.2 | 6,919 |
| Wyoming | 17.0 | 17.0 | 0.0 | 1,090 |
| Connecticut | 27.3 | 14.7 | −12.6 | 4,885 |
| United States | 28.4 | 32.2 | +3.8 | 1,017,967 |
Download 19-06-public-welfare-share-of-spending-2014-2024.csv
Download SVG · CSV. Data and chart licensed CC BY 4.0.
Higgins Strategy. “Public welfare, which is mostly Medicaid, took 32% of state general spending in 2024, up from 28% in 2014; it is 35% in Maryland and 29% in Virginia” Exhibit 6, Every State Dollar (Study XIX). October 12, 2026. https://higginsstrategy.com/charts/19-06-public-welfare-share-of-spending-2014-2024/