By the states’ own budget accounts, federal funds paid for 34% of all state spending in fiscal 2025: 49% in Louisiana, 31% in Maryland, 28% in Virginia
Method and data
Method. NASBO’s figures are the states’ own, reported by budget office on each state’s accounting basis, and fiscal 2025 is the states’ estimate at the time of the survey. Total spending here includes general funds, federal funds, other state funds and bonds; it differs from Census’s general revenue in coverage and timing, which is why Exhibits 1 and 4 do not match state by state. Census measures revenue by its nature and NASBO measures spending by state fund, so the two diverge most where a state reports large restricted or non-appropriated funds. Since 2022 Arizona has included non-appropriated spending in NASBO’s totals (NASBO, 2025 State Expenditure Report, General Notes). In fiscal 2024 NASBO’s Arizona federal funds ($25.4 billion) were close to Census’s federal revenue ($27.6 billion), but NASBO’s total spending was $96.4 billion against Census’s $60.9 billion of general revenue. Wyoming and West Virginia diverge by as much. NASBO lists the District outside its 50-state total for fiscal 2023 and 2024 and reports no fiscal 2025 figure for it.
| State | General fund, FY2025 ($ million) | Federal funds | Other state funds | Bonds | Total | Federal share (%) | Rank |
|---|---|---|---|---|---|---|---|
| Louisiana | 13,027 | 23,468 | 11,303 | 537 | 48,335 | 48.6 | 1 |
| Indiana | 21,474 | 21,850 | 3,790 | 0 | 47,114 | 46.4 | 2 |
| Alaska | 6,256 | 7,167 | 2,401 | 0 | 15,824 | 45.3 | 3 |
| Mississippi | 7,041 | 14,307 | 10,290 | 331 | 31,969 | 44.8 | 4 |
| New Mexico | 10,419 | 13,159 | 5,895 | 174 | 29,647 | 44.4 | 5 |
| Tennessee | 24,219 | 25,467 | 9,046 | 0 | 58,732 | 43.4 | 6 |
| Missouri | 14,129 | 17,738 | 9,293 | 9 | 41,169 | 43.1 | 7 |
| South Dakota | 2,392 | 2,910 | 1,564 | 5 | 6,871 | 42.4 | 8 |
| Michigan | 14,876 | 33,885 | 31,943 | 297 | 81,001 | 41.8 | 9 |
| Montana | 2,859 | 4,288 | 3,348 | 0 | 10,495 | 40.9 | 10 |
| Oklahoma | 7,932 | 12,323 | 9,691 | 586 | 30,532 | 40.4 | 11 |
| North Carolina | 31,300 | 33,090 | 18,285 | 563 | 83,238 | 39.8 | 12 |
| Kentucky | 15,931 | 22,557 | 18,743 | 0 | 57,231 | 39.4 | 13 |
| New Hampshire | 2,010 | 3,485 | 3,318 | 34 | 8,847 | 39.4 | 14 |
| Pennsylvania | 47,905 | 50,628 | 28,487 | 1,551 | 128,571 | 39.4 | 15 |
| Alabama | 15,655 | 17,284 | 10,616 | 359 | 43,914 | 39.4 | 16 |
| Ohio | 29,415 | 40,585 | 33,167 | 1,535 | 104,702 | 38.8 | 17 |
| New York | 97,846 | 93,455 | 42,414 | 7,756 | 241,471 | 38.7 | 18 |
| Rhode Island | 5,598 | 5,613 | 3,209 | 147 | 14,567 | 38.5 | 19 |
| Idaho | 5,325 | 6,173 | 4,608 | 0 | 16,106 | 38.3 | 20 |
| Vermont | 2,419 | 3,422 | 3,063 | 57 | 8,961 | 38.2 | 21 |
| Maine | 5,485 | 5,354 | 3,645 | 38 | 14,522 | 36.9 | 22 |
| Nevada | 6,149 | 7,722 | 7,082 | 68 | 21,021 | 36.7 | 23 |
| Texas | 46,831 | 52,656 | 46,281 | 852 | 146,620 | 35.9 | 24 |
| North Dakota | 2,900 | 2,706 | 2,240 | 7 | 7,853 | 34.5 | 25 |
| Arkansas | 6,164 | 11,032 | 15,294 | 50 | 32,540 | 33.9 | 26 |
| California | 233,577 | 172,349 | 98,637 | 5,720 | 510,283 | 33.8 | 27 |
| Florida | 49,932 | 39,827 | 27,202 | 1,944 | 118,905 | 33.5 | 28 |
| Iowa | 8,972 | 10,945 | 13,105 | 0 | 33,022 | 33.1 | 29 |
| South Carolina | 14,225 | 13,791 | 13,762 | 0 | 41,778 | 33.0 | 30 |
| Maryland | 27,457 | 22,169 | 19,181 | 2,134 | 70,941 | 31.2 | 31 |
| Minnesota | 35,553 | 22,339 | 13,187 | 1,031 | 72,110 | 31.0 | 32 |
| Oregon | 16,726 | 19,382 | 26,853 | 851 | 63,812 | 30.4 | 33 |
| New Jersey | 56,906 | 29,948 | 12,656 | 1,652 | 101,162 | 29.6 | 34 |
| Utah | 12,657 | 8,432 | 7,404 | 0 | 28,493 | 29.6 | 35 |
| Georgia | 38,041 | 21,568 | 15,333 | 0 | 74,942 | 28.8 | 36 |
| Colorado | 16,213 | 13,202 | 16,301 | 544 | 46,260 | 28.5 | 37 |
| Virginia | 32,948 | 24,768 | 30,780 | 909 | 89,405 | 27.7 | 38 |
| Nebraska | 5,475 | 5,595 | 9,155 | 0 | 20,225 | 27.7 | 39 |
| Massachusetts | 40,158 | 24,549 | 21,226 | 3,276 | 89,209 | 27.5 | 40 |
| Kansas | 10,315 | 7,653 | 9,695 | 317 | 27,980 | 27.4 | 41 |
| Wisconsin | 21,118 | 18,456 | 29,048 | 0 | 68,622 | 26.9 | 42 |
| Washington | 35,595 | 20,613 | 21,943 | 3,541 | 81,692 | 25.2 | 43 |
| Connecticut | 23,425 | 11,239 | 6,955 | 3,674 | 45,293 | 24.8 | 44 |
| Arizona | 16,245 | 17,982 | 38,896 | 442 | 73,565 | 24.4 | 45 |
| Delaware | 6,925 | 3,934 | 6,317 | 299 | 17,475 | 22.5 | 46 |
| Hawaii | 10,931 | 4,454 | 3,762 | 933 | 20,080 | 22.2 | 47 |
| West Virginia | 4,827 | 5,551 | 16,455 | 185 | 27,018 | 20.5 | 48 |
| Wyoming | 1,654 | 1,006 | 2,928 | 0 | 5,588 | 18.0 | 49 |
| Illinois | 50,576 | 25,062 | 74,090 | 2,338 | 152,066 | 16.5 | 50 |
| All states | 1,216,008 | 1,077,138 | 873,887 | 44,746 | 3,211,779 | 33.5 |
Download 19-04-federal-funds-share-of-state-spending-fy2025.csv
Download SVG · CSV. Data and chart licensed CC BY 4.0.
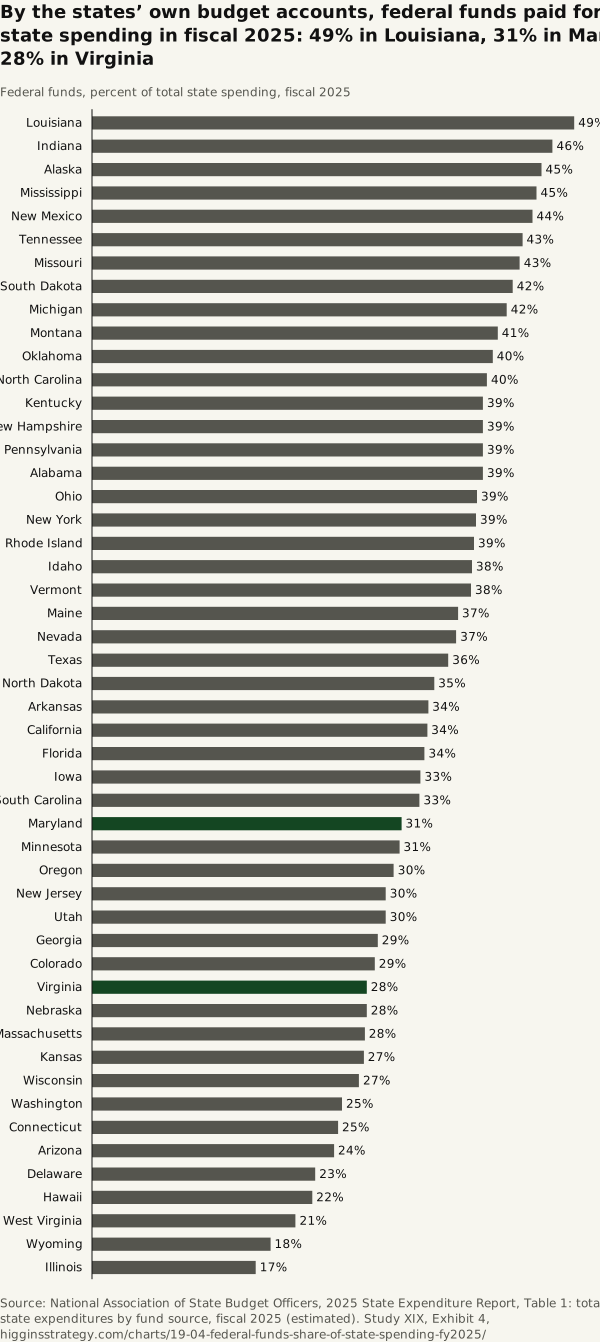
Higgins Strategy. “By the states’ own budget accounts, federal funds paid for 34% of all state spending in fiscal 2025: 49% in Louisiana, 31% in Maryland, 28% in Virginia” Exhibit 4, Every State Dollar (Study XIX). October 12, 2026. https://higginsstrategy.com/charts/19-04-federal-funds-share-of-state-spending-fy2025/