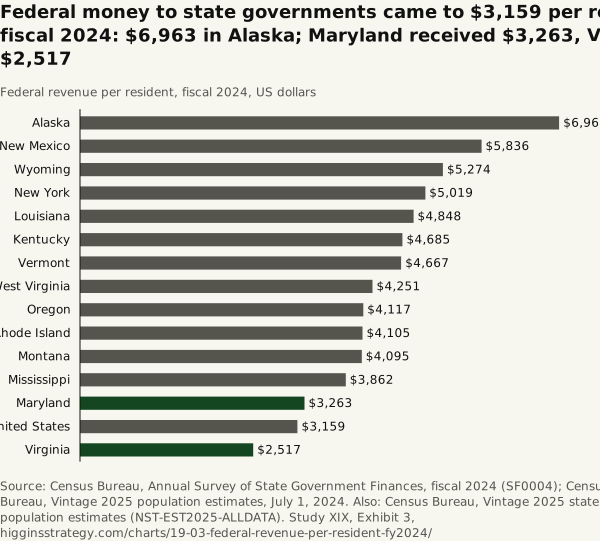
Federal money to state governments came to $3,159 per resident in fiscal 2024: $6,963 in Alaska; Maryland received $3,263, Virginia $2,517
Source. Census Bureau, Annual Survey of State Government Finances, fiscal 2024 (SF0004); Census Bureau, Vintage 2025 population estimates, July 1, 2024. Also: Census Bureau, Vintage 2025 state population estimates (NST-EST2025-ALLDATA).
Method and data
Method. Federal revenue of the state government only; grants that go directly to cities, counties, school districts, hospitals or people are not here. Per-resident figures are highest where Medicaid enrollment or poverty is large relative to population and where the state, rather than its localities, runs the programs. The United States figure divides the fifty states’ federal revenue by the fifty states’ population, 339,312,487 (340,003,797 less the District’s 691,310). Own-source revenue (SF0035) per resident, on the same populations: Virginia $59,640 million ÷ 8,819,642 = $6,762; the fifty states $2,040,031 million ÷ 339,312,487 = $6,012. The table carries all fifty states.
| State | Federal revenue per resident, FY2024 ($) | Population, July 2024 | Rank |
|---|---|---|---|
| Alaska | 6,963 | 736,537 | 1 |
| New Mexico | 5,836 | 2,126,774 | 2 |
| Wyoming | 5,274 | 586,722 | 3 |
| New York | 5,019 | 20,001,419 | 4 |
| Louisiana | 4,848 | 4,614,878 | 5 |
| Kentucky | 4,685 | 4,584,046 | 6 |
| Vermont | 4,667 | 646,521 | 7 |
| West Virginia | 4,251 | 1,767,402 | 8 |
| Oregon | 4,117 | 4,265,324 | 9 |
| Rhode Island | 4,105 | 1,110,415 | 10 |
| Montana | 4,095 | 1,137,557 | 11 |
| Mississippi | 3,862 | 2,950,172 | 12 |
| Delaware | 3,757 | 1,050,123 | 13 |
| Arizona | 3,646 | 7,556,424 | 14 |
| Maine | 3,627 | 1,408,438 | 15 |
| Arkansas | 3,555 | 3,096,080 | 16 |
| North Dakota | 3,504 | 793,387 | 17 |
| Oklahoma | 3,477 | 4,097,758 | 18 |
| Massachusetts | 3,415 | 7,138,560 | 19 |
| Pennsylvania | 3,410 | 13,045,848 | 20 |
| Indiana | 3,403 | 6,934,754 | 21 |
| California | 3,398 | 39,364,774 | 22 |
| Minnesota | 3,367 | 5,797,405 | 23 |
| Hawaii | 3,360 | 1,434,952 | 24 |
| Michigan | 3,323 | 10,099,962 | 25 |
| Alabama | 3,282 | 5,163,055 | 26 |
| Maryland | 3,263 | 6,245,314 | 27 |
| Ohio | 3,236 | 11,860,621 | 28 |
| Iowa | 3,219 | 3,230,454 | 29 |
| Missouri | 3,188 | 6,243,544 | 30 |
| Connecticut | 3,157 | 3,674,449 | 31 |
| New Jersey | 3,125 | 9,506,354 | 32 |
| South Dakota | 3,058 | 927,110 | 33 |
| Nebraska | 2,944 | 2,005,591 | 34 |
| North Carolina | 2,843 | 11,052,061 | 35 |
| Illinois | 2,830 | 12,703,033 | 36 |
| Washington | 2,816 | 7,927,958 | 37 |
| Tennessee | 2,766 | 7,251,291 | 38 |
| Colorado | 2,737 | 5,988,502 | 39 |
| South Carolina | 2,729 | 5,490,316 | 40 |
| Wisconsin | 2,571 | 5,957,168 | 41 |
| Nevada | 2,564 | 3,253,543 | 42 |
| Virginia | 2,517 | 8,819,642 | 43 |
| Utah | 2,416 | 3,502,983 | 44 |
| Kansas | 2,410 | 2,965,252 | 45 |
| New Hampshire | 2,310 | 1,408,518 | 46 |
| Georgia | 2,285 | 11,204,208 | 47 |
| Idaho | 2,252 | 2,000,872 | 48 |
| Texas | 2,186 | 31,318,578 | 49 |
| Florida | 2,104 | 23,265,838 | 50 |
| United States | 3,159 | 339,312,487 |
Download SVG · CSV. Data and chart licensed CC BY 4.0.
Higgins Strategy. “Federal money to state governments came to $3,159 per resident in fiscal 2024: $6,963 in Alaska; Maryland received $3,263, Virginia $2,517” Exhibit 3, Every State Dollar (Study XIX). October 12, 2026. https://higginsstrategy.com/charts/19-03-federal-revenue-per-resident-fy2024/