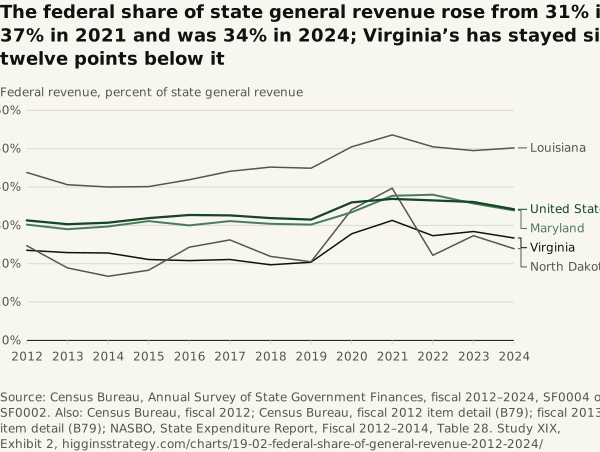
The federal share of state general revenue rose from 31% in 2012 to 37% in 2021 and was 34% in 2024; Virginia’s has stayed six to twelve points below it
Source. Census Bureau, Annual Survey of State Government Finances, fiscal 2012–2024, SF0004 over SF0002. Also: Census Bureau, fiscal 2012; Census Bureau, fiscal 2012 item detail (B79); fiscal 2013 item detail (B79); NASBO, State Expenditure Report, Fiscal 2012–2014, Table 28.
Method and data
Method. Louisiana and North Dakota are the highest and lowest states in 2024. The table carries all fifty states. Kansas’s fiscal 2012 cell is left blank: Census’s figure ($1.64 billion, 44% of its 2013 level of $3.75 billion) omits most federal Medicaid revenue. Its federal public-welfare line is $162 million, against $1,887 million in 2013, and NASBO reports Kansas spent $1,510 million of federal Medicaid funds in fiscal 2012. The US total is as Census publishes it.
| State | 2012 | 2013 | 2014 | 2015 | 2016 | 2017 | 2018 | 2019 | 2020 | 2021 | 2022 | 2023 | 2024 |
|---|---|---|---|---|---|---|---|---|---|---|---|---|---|
| United States | 31.3 | 30.3 | 30.7 | 31.9 | 32.7 | 32.6 | 31.9 | 31.5 | 36.0 | 36.9 | 36.5 | 36.1 | 34.2 |
| Alabama | 40.2 | 40.1 | 38.3 | 37.6 | 36.3 | 37.1 | 36.6 | 36.5 | 40.3 | 41.0 | 43.1 | 40.0 | 37.8 |
| Alaska | 20.0 | 22.4 | 26.9 | 34.4 | 38.0 | 39.2 | 42.2 | 42.5 | 50.7 | 57.2 | 50.1 | 47.0 | 48.8 |
| Arizona | 36.5 | 34.5 | 35.5 | 41.8 | 40.9 | 42.2 | 42.0 | 41.0 | 47.0 | 48.5 | 49.9 | 47.8 | 45.3 |
| Arkansas | 34.6 | 33.0 | 33.7 | 36.1 | 36.4 | 36.9 | 36.3 | 35.5 | 39.7 | 40.3 | 42.1 | 40.7 | 38.0 |
| California | 27.2 | 25.0 | 26.0 | 30.4 | 32.0 | 30.6 | 30.8 | 30.1 | 31.0 | 27.8 | 28.1 | 33.0 | 28.0 |
| Colorado | 29.0 | 27.9 | 29.2 | 30.1 | 31.3 | 31.0 | 30.0 | 28.2 | 34.1 | 35.7 | 34.3 | 35.9 | 36.0 |
| Connecticut | 24.1 | 24.1 | 25.1 | 26.0 | 27.6 | 26.6 | 23.9 | 26.1 | 26.5 | 30.4 | 29.5 | 30.5 | 29.6 |
| Delaware | 24.7 | 24.7 | 27.2 | 25.3 | 27.0 | 28.6 | 27.8 | 26.4 | 38.2 | 40.2 | 31.5 | 30.0 | 28.9 |
| Florida | 32.1 | 31.4 | 32.3 | 32.0 | 31.7 | 30.9 | 30.5 | 31.2 | 36.5 | 37.1 | 40.1 | 37.6 | 34.4 |
| Georgia | 37.0 | 36.3 | 35.8 | 34.9 | 34.4 | 34.3 | 33.7 | 33.2 | 36.9 | 43.0 | 36.5 | 40.3 | 38.1 |
| Hawaii | 22.2 | 20.8 | 24.2 | 22.3 | 22.7 | 20.2 | 21.0 | 19.5 | 24.4 | 41.9 | 25.9 | 24.1 | 24.0 |
| Idaho | 34.9 | 34.3 | 33.8 | 32.4 | 31.6 | 30.7 | 30.7 | 32.7 | 40.6 | 38.7 | 35.3 | 34.9 | 28.8 |
| Illinois | 25.6 | 25.8 | 26.3 | 28.1 | 29.7 | 28.6 | 28.9 | 26.6 | 31.9 | 31.6 | 36.0 | 30.2 | 30.4 |
| Indiana | 32.1 | 33.4 | 32.7 | 35.6 | 37.8 | 37.8 | 34.7 | 34.2 | 46.4 | 46.2 | 43.1 | 42.6 | 41.0 |
| Iowa | 27.9 | 26.1 | 26.8 | 27.0 | 27.1 | 27.5 | 27.8 | 27.8 | 32.5 | 32.2 | 34.4 | 33.5 | 32.6 |
| Kansas | 24.1 | 24.9 | 23.5 | 22.6 | 23.5 | 21.4 | 21.4 | 27.7 | 26.9 | 29.9 | 26.5 | 24.9 | |
| Kentucky | 35.5 | 34.3 | 38.0 | 38.9 | 40.9 | 40.7 | 40.5 | 39.7 | 44.4 | 46.2 | 46.4 | 43.7 | 44.3 |
| Louisiana | 43.8 | 40.6 | 40.0 | 40.1 | 41.9 | 44.1 | 45.2 | 44.9 | 50.5 | 53.6 | 50.5 | 49.5 | 50.2 |
| Maine | 35.4 | 34.5 | 35.9 | 33.8 | 34.1 | 34.3 | 34.0 | 33.6 | 42.9 | 41.4 | 40.7 | 39.8 | 38.0 |
| Maryland | 30.2 | 29.0 | 29.7 | 31.1 | 30.0 | 31.1 | 30.4 | 30.2 | 33.4 | 37.7 | 38.0 | 35.7 | 33.9 |
| Massachusetts | 29.1 | 28.5 | 27.4 | 27.8 | 29.0 | 28.8 | 28.4 | 28.0 | 32.4 | 36.2 | 32.0 | 31.3 | 29.8 |
| Michigan | 33.8 | 32.8 | 32.3 | 34.0 | 33.8 | 32.8 | 32.2 | 33.1 | 38.3 | 37.0 | 38.7 | 36.6 | 36.3 |
| Minnesota | 26.3 | 23.5 | 24.1 | 26.9 | 26.8 | 26.0 | 26.0 | 25.4 | 31.0 | 29.3 | 33.0 | 32.1 | 31.0 |
| Mississippi | 45.3 | 42.9 | 40.9 | 42.1 | 43.4 | 42.7 | 42.7 | 42.0 | 47.1 | 45.2 | 45.1 | 43.2 | 42.0 |
| Missouri | 39.5 | 38.2 | 38.0 | 37.3 | 37.2 | 37.7 | 38.1 | 37.7 | 44.6 | 40.4 | 46.9 | 45.7 | 43.2 |
| Montana | 41.3 | 40.0 | 39.5 | 39.3 | 42.0 | 45.7 | 44.5 | 43.8 | 46.5 | 51.5 | 42.7 | 44.7 | 43.8 |
| Nebraska | 33.7 | 31.6 | 30.4 | 29.4 | 30.8 | 30.7 | 30.9 | 30.0 | 37.7 | 37.7 | 39.0 | 38.2 | 34.7 |
| Nevada | 25.7 | 25.0 | 25.1 | 30.4 | 31.4 | 32.7 | 32.8 | 31.1 | 33.0 | 34.3 | 37.0 | 32.3 | 31.9 |
| New Hampshire | 29.1 | 27.2 | 30.8 | 31.0 | 31.9 | 32.9 | 31.6 | 31.7 | 42.5 | 40.3 | 40.3 | 37.2 | 34.6 |
| New Jersey | 26.4 | 25.7 | 27.2 | 28.6 | 28.1 | 27.0 | 25.6 | 24.9 | 27.2 | 29.6 | 29.6 | 30.6 | 29.8 |
| New Mexico | 35.7 | 36.1 | 34.5 | 39.4 | 44.1 | 42.7 | 41.7 | 35.4 | 40.6 | 46.8 | 35.5 | 32.2 | 30.9 |
| New York | 33.5 | 33.3 | 33.2 | 33.0 | 34.3 | 37.0 | 36.6 | 37.2 | 37.2 | 41.3 | 38.6 | 38.1 | 39.5 |
| North Carolina | 37.9 | 37.1 | 35.8 | 34.8 | 33.8 | 33.4 | 32.9 | 32.8 | 36.2 | 37.8 | 38.5 | 35.3 | 36.1 |
| North Dakota | 24.7 | 18.9 | 16.7 | 18.3 | 24.3 | 26.2 | 21.9 | 20.5 | 34.1 | 39.7 | 22.2 | 27.3 | 23.9 |
| Ohio | 33.5 | 32.8 | 34.2 | 35.1 | 35.6 | 34.5 | 34.4 | 33.9 | 39.0 | 40.5 | 41.5 | 38.4 | 39.2 |
| Oklahoma | 35.5 | 33.8 | 34.1 | 32.1 | 33.6 | 34.1 | 31.6 | 30.3 | 36.8 | 36.9 | 43.5 | 44.0 | 40.9 |
| Oregon | 33.6 | 31.5 | 32.0 | 35.3 | 34.6 | 32.9 | 32.5 | 31.5 | 36.3 | 33.0 | 37.9 | 34.5 | 36.9 |
| Pennsylvania | 30.6 | 30.4 | 30.9 | 30.6 | 32.8 | 34.8 | 33.3 | 33.6 | 39.1 | 39.2 | 38.5 | 39.2 | 36.0 |
| Rhode Island | 32.3 | 30.8 | 34.0 | 34.6 | 34.8 | 34.6 | 34.5 | 33.1 | 42.7 | 50.5 | 43.8 | 40.3 | 36.8 |
| South Carolina | 32.4 | 30.8 | 34.9 | 35.9 | 34.8 | 35.8 | 34.7 | 32.3 | 37.6 | 36.5 | 39.7 | 39.5 | 32.8 |
| South Dakota | 40.5 | 38.8 | 36.8 | 35.2 | 33.6 | 35.0 | 33.3 | 33.5 | 50.1 | 38.3 | 49.4 | 40.1 | 41.6 |
| Tennessee | 42.6 | 41.0 | 40.5 | 38.6 | 39.5 | 38.3 | 37.2 | 36.2 | 40.0 | 41.3 | 41.8 | 41.6 | 40.5 |
| Texas | 30.7 | 29.4 | 29.1 | 31.0 | 33.6 | 33.2 | 32.0 | 31.7 | 38.9 | 43.7 | 38.9 | 36.0 | 32.9 |
| Utah | 31.5 | 28.7 | 28.0 | 26.7 | 25.8 | 25.2 | 23.6 | 22.6 | 27.3 | 27.0 | 29.3 | 27.9 | 26.7 |
| Vermont | 34.7 | 33.6 | 33.8 | 35.4 | 35.1 | 32.5 | 32.7 | 31.3 | 43.4 | 34.4 | 43.3 | 36.7 | 33.8 |
| Virginia | 23.5 | 22.9 | 22.8 | 21.1 | 20.8 | 21.1 | 19.7 | 20.4 | 27.8 | 31.3 | 27.3 | 28.4 | 26.7 |
| Washington | 28.5 | 27.1 | 29.3 | 30.9 | 30.1 | 29.2 | 27.8 | 26.3 | 28.7 | 32.6 | 34.0 | 32.5 | 30.2 |
| West Virginia | 34.7 | 34.1 | 34.8 | 35.3 | 37.2 | 39.0 | 37.2 | 37.2 | 44.7 | 41.9 | 45.1 | 42.2 | 40.6 |
| Wisconsin | 28.1 | 27.7 | 27.8 | 27.5 | 26.7 | 26.3 | 25.6 | 26.7 | 31.3 | 30.9 | 33.0 | 31.5 | 30.3 |
| Wyoming | 47.8 | 45.8 | 46.4 | 44.2 | 47.5 | 46.4 | 42.1 | 41.2 | 56.3 | 48.5 | 49.0 | 48.1 | 40.1 |
Download 19-02-federal-share-of-general-revenue-2012-2024.csv
Download SVG · CSV. Data and chart licensed CC BY 4.0.
Higgins Strategy. “The federal share of state general revenue rose from 31% in 2012 to 37% in 2021 and was 34% in 2024; Virginia’s has stayed six to twelve points below it” Exhibit 2, Every State Dollar (Study XIX). October 12, 2026. https://higginsstrategy.com/charts/19-02-federal-share-of-general-revenue-2012-2024/