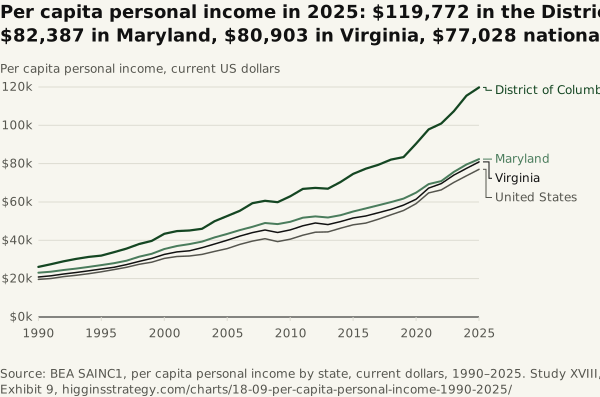
Per capita personal income in 2025: $119,772 in the District, $82,387 in Maryland, $80,903 in Virginia, $77,028 nationally
Source. BEA SAINC1, per capita personal income by state, current dollars, 1990–2025.
Method and data
Method. Personal income divided by midyear population, by place of residence, so commuters’ earnings count where they live. Maryland was 118% of the national figure in 1990 and 107% in 2025; Virginia 106% and 105%.
| Year | DC ($) | Maryland | Virginia | United States |
|---|---|---|---|---|
| 1990 | 26,117 | 23,104 | 20,840 | 19,619 |
| 1991 | 27,527 | 23,627 | 21,452 | 20,050 |
| 1992 | 29,036 | 24,492 | 22,390 | 21,077 |
| 1993 | 30,311 | 25,222 | 23,180 | 21,713 |
| 1994 | 31,325 | 26,140 | 24,085 | 22,552 |
| 1995 | 32,021 | 27,039 | 25,011 | 23,577 |
| 1996 | 33,799 | 28,070 | 25,935 | 24,725 |
| 1997 | 35,657 | 29,363 | 27,328 | 25,925 |
| 1998 | 38,064 | 31,417 | 28,965 | 27,493 |
| 1999 | 39,679 | 32,948 | 30,574 | 28,592 |
| 2000 | 43,401 | 35,480 | 32,631 | 30,551 |
| 2001 | 44,809 | 37,012 | 33,940 | 31,548 |
| 2002 | 45,124 | 37,995 | 34,495 | 31,801 |
| 2003 | 45,978 | 39,295 | 36,151 | 32,659 |
| 2004 | 49,986 | 41,515 | 38,082 | 34,183 |
| 2005 | 52,686 | 43,311 | 40,027 | 35,669 |
| 2006 | 55,384 | 45,293 | 42,164 | 37,843 |
| 2007 | 59,358 | 47,033 | 44,020 | 39,588 |
| 2008 | 60,609 | 49,026 | 45,383 | 40,854 |
| 2009 | 59,881 | 48,457 | 44,092 | 39,307 |
| 2010 | 62,977 | 49,629 | 45,442 | 40,557 |
| 2011 | 66,793 | 51,811 | 47,561 | 42,650 |
| 2012 | 67,356 | 52,492 | 49,047 | 44,238 |
| 2013 | 66,930 | 51,882 | 48,193 | 44,402 |
| 2014 | 70,395 | 53,085 | 49,755 | 46,289 |
| 2015 | 74,650 | 55,042 | 51,611 | 48,062 |
| 2016 | 77,354 | 56,615 | 52,650 | 48,974 |
| 2017 | 79,409 | 58,252 | 54,371 | 51,006 |
| 2018 | 82,090 | 59,922 | 56,124 | 53,311 |
| 2019 | 83,429 | 61,730 | 58,356 | 55,567 |
| 2020 | 90,449 | 64,871 | 61,446 | 59,151 |
| 2021 | 97,855 | 69,296 | 67,220 | 64,718 |
| 2022 | 100,947 | 70,900 | 69,571 | 66,316 |
| 2023 | 107,332 | 75,673 | 74,000 | 70,191 |
| 2024 | 115,442 | 79,558 | 77,492 | 73,634 |
| 2025 | 119,772 | 82,387 | 80,903 | 77,028 |
Download SVG · CSV. Data and chart licensed CC BY 4.0.
Higgins Strategy. “Per capita personal income in 2025: $119,772 in the District, $82,387 in Maryland, $80,903 in Virginia, $77,028 nationally” Exhibit 9, What the Region Makes (Study XVIII). October 12, 2026. https://higginsstrategy.com/charts/18-09-per-capita-personal-income-1990-2025/