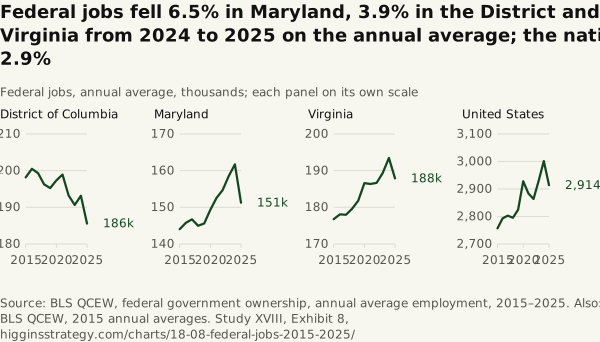
Federal jobs fell 6.5% in Maryland, 3.9% in the District and 2.9% in Virginia from 2024 to 2025 on the annual average; the nation fell 2.9%
Source. BLS QCEW, federal government ownership, annual average employment, 2015–2025. Also: BLS QCEW, 2015 annual averages.
Method and data
Method. Annual averages of monthly employment, so 2025 blends the January level with the separations through the year; the December-to-December change is larger. Each panel has its own scale. Study VIII counts the same fall by month.
| Year | DC | Maryland | Virginia | United States |
|---|---|---|---|---|
| 2015 | 198,144 | 144,023 | 176,757 | 2,756,434 |
| 2016 | 200,481 | 145,783 | 178,073 | 2,792,987 |
| 2017 | 199,323 | 146,707 | 177,948 | 2,802,583 |
| 2018 | 196,240 | 144,963 | 179,578 | 2,795,195 |
| 2019 | 195,231 | 145,576 | 181,770 | 2,824,154 |
| 2020 | 197,345 | 149,351 | 186,562 | 2,928,036 |
| 2021 | 198,925 | 152,531 | 186,366 | 2,883,380 |
| 2022 | 193,207 | 154,650 | 186,654 | 2,863,607 |
| 2023 | 190,617 | 158,475 | 189,324 | 2,929,938 |
| 2024 | 193,145 | 161,701 | 193,433 | 3,001,207 |
| 2025 | 185,546 | 151,248 | 187,884 | 2,913,515 |
Download SVG · CSV. Data and chart licensed CC BY 4.0.
Higgins Strategy. “Federal jobs fell 6.5% in Maryland, 3.9% in the District and 2.9% in Virginia from 2024 to 2025 on the annual average; the nation fell 2.9%” Exhibit 8, What the Region Makes (Study XVIII). October 12, 2026. https://higginsstrategy.com/charts/18-08-federal-jobs-2015-2025/